
- Bitcoin price continues to surge, reaching eight consecutive up days and the best eight-day return since February.
- Ethereum price climbs over 27% over the last eight days, suggesting a pause in the rally very soon.
- XRP price briefly asserts strength above descending parallel channel before reversing from the 200-day simple moving average (SMA).
Bitcoin price approaches the fierce resistance between $41,300 and $42,600 while Ethereum price continues to hold critical resistance and XRP price approaches a double-digit gain today.
Bitcoin price impulsiveness solidifies a firm bottom
Bitcoin price is on pace to close with eight consecutive up days for the first time since December 2020 and has registered an eight-day return of 33% at the time of writing, marking the best gain since the February breakout from a minor cup base. Moreover, the sharpness of the rebound has pushed the daily Relative Strength Index (RSI) close to an overbought reading for the first time since March.
The remarkable rise began with a brief drop below the psychologically important $30,000 and the neckline of a multi-month head-and-shoulders top that was quickly reversed, driving Bitcoin price to confirm a breakout from a falling wedge pattern on July 22. The result was a bullish engulfing week on the bar charts at the 50-week sma, preparing BTC for the sling-shot higher this week.
The quickness and magnitude of the burst higher has instigated a wave of short-covering that has put Bitcoin price near the imposing resistance formed by the June 15 high of $41,322, the January high of $41,986 and the 38.2% Fibonacci retracement of the April-June correction at $42,589. Reinforcing the resistance range is the strategically important 200-day SMA at $44,644.

BTC/USD daily chart
On a comparative basis, Bitcoin price has notably outperformed the S&P 500 after striking support at the 2017 high on July 20, highlighting the interest of investment capital to pursue more aggressive risk-on assets.
The duration of the outperformance is the longest since February, again expressing the persistence of the bid in higher risk-on investment opportunities.
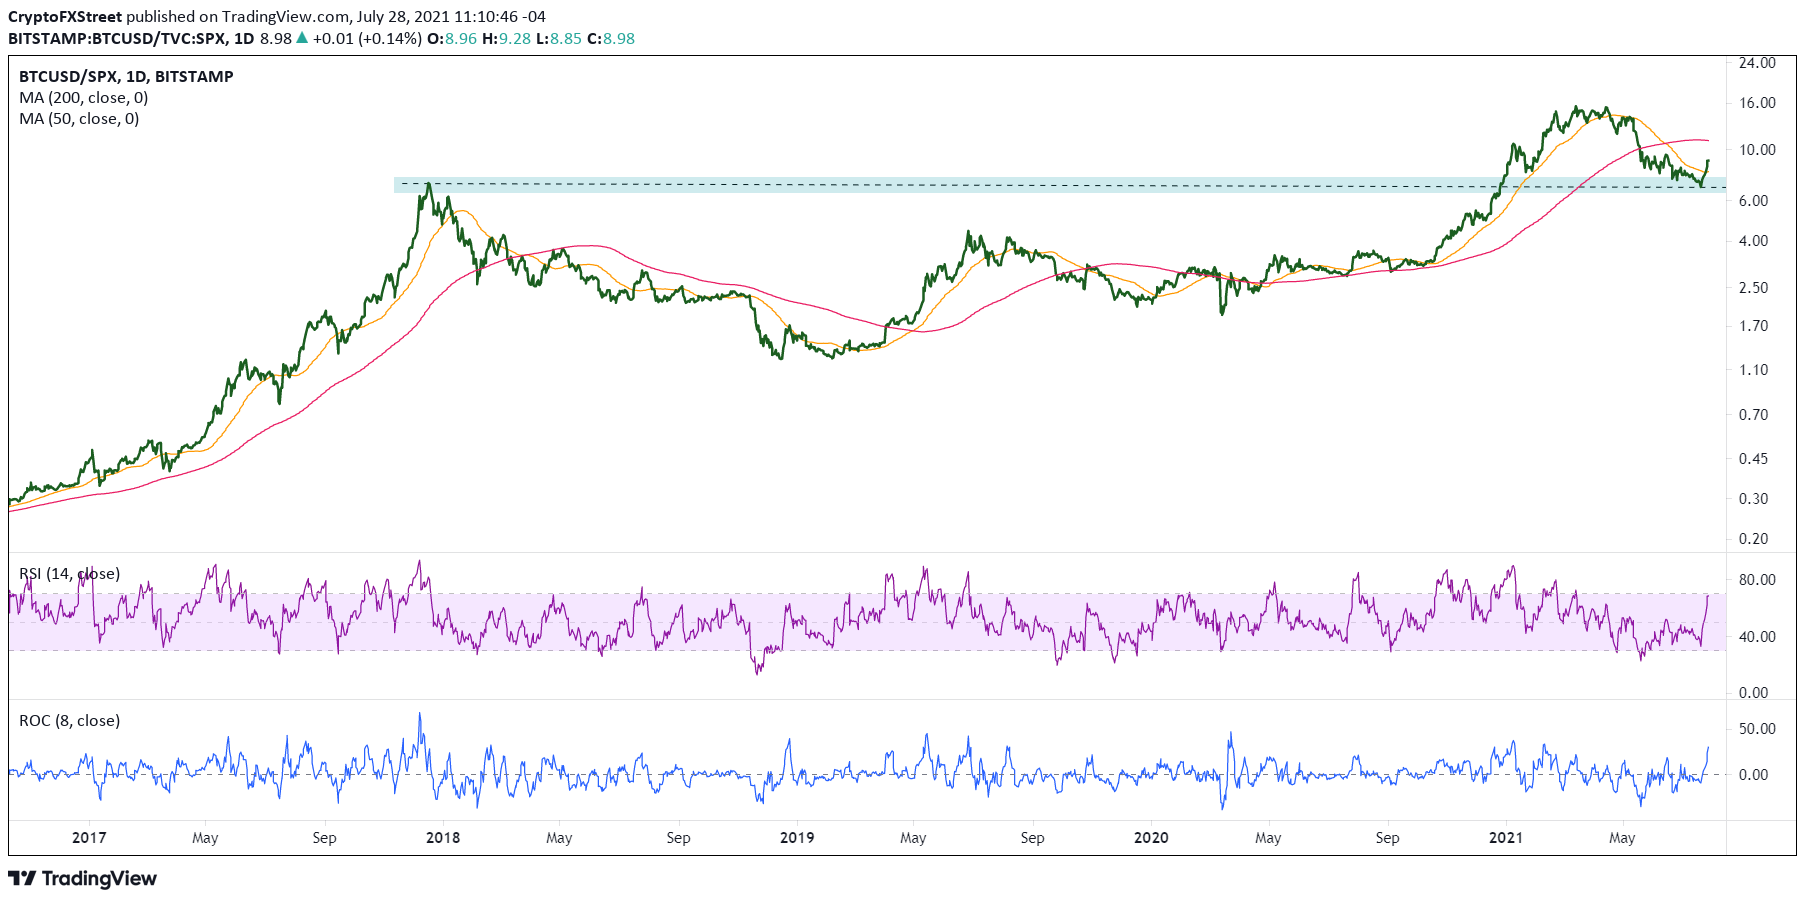
BTCUSD/SPX daily chart
The impulsive thrust off the July low points to a departure from other rebounds during this correction in terms of magnitude and relentless momentum that is supported by improved volume totals. It was one of the few instances when Bitcoin rallied by 33% over eight days, and it occurred off a low, not during an advance. Of note is the March 2020 low. BTC leaped 34% over an eight-day period, laying the groundwork for the historic advance.
Moreover, the rally gains importance since it originated from the 50-week SMA and 12-month SMA, broke out from a bullish falling wedge pattern and was confirmed with the bullish outside week this past week.

BTC/USD weekly chart
With Bitcoin price now knocking on the door of resistance, it is imperative to note the support levels briefly. The first layer of support is the June 29 high of $36,675, followed by the 50-day SMA at $38,220, yielding a 13% decline from the current price. It would not disrupt the bullish intentions of BTC proclaimed by the flagship cryptocurrency over the last eight days.
A drop below the moving average on a daily closing basis does introduce concern and leaves Bitcoin price vulnerable to a test of the upper trendline of the falling wedge and the neckline. Any further weakness below those levels confirms a dead cat bounce and a revival of the corrective process.
Here, FXStreet's analysts evaluate where BTC could be heading next as it seems bound for a rebound before capitulation.


