
- Bitcoin price closed the week up 9.94% for the third consecutive positive week.
- Ethereum price closed the week up 17.95%, marking the best week since the beginning of May.
- XRP price closed the week up 7.52% for the third consecutive positive week and the first time since early April.
Bitcoin price shrugs off resistance, while ETH and XRP are retesting the breakouts. The overall impulsiveness of the rally has not diminished as the three cryptocurrencies are overcoming widespread doubt and concerns.
Bitcoin price quickly discards resistance
Bitcoin price is up 54% since July 21, marking the third-best gain 20-day gain in 2021 and lifting BTC 285% over the last 52-weeks. The impulsive action began with a bullish outside week on the bar charts at the 50-week simple moving average (SMA).
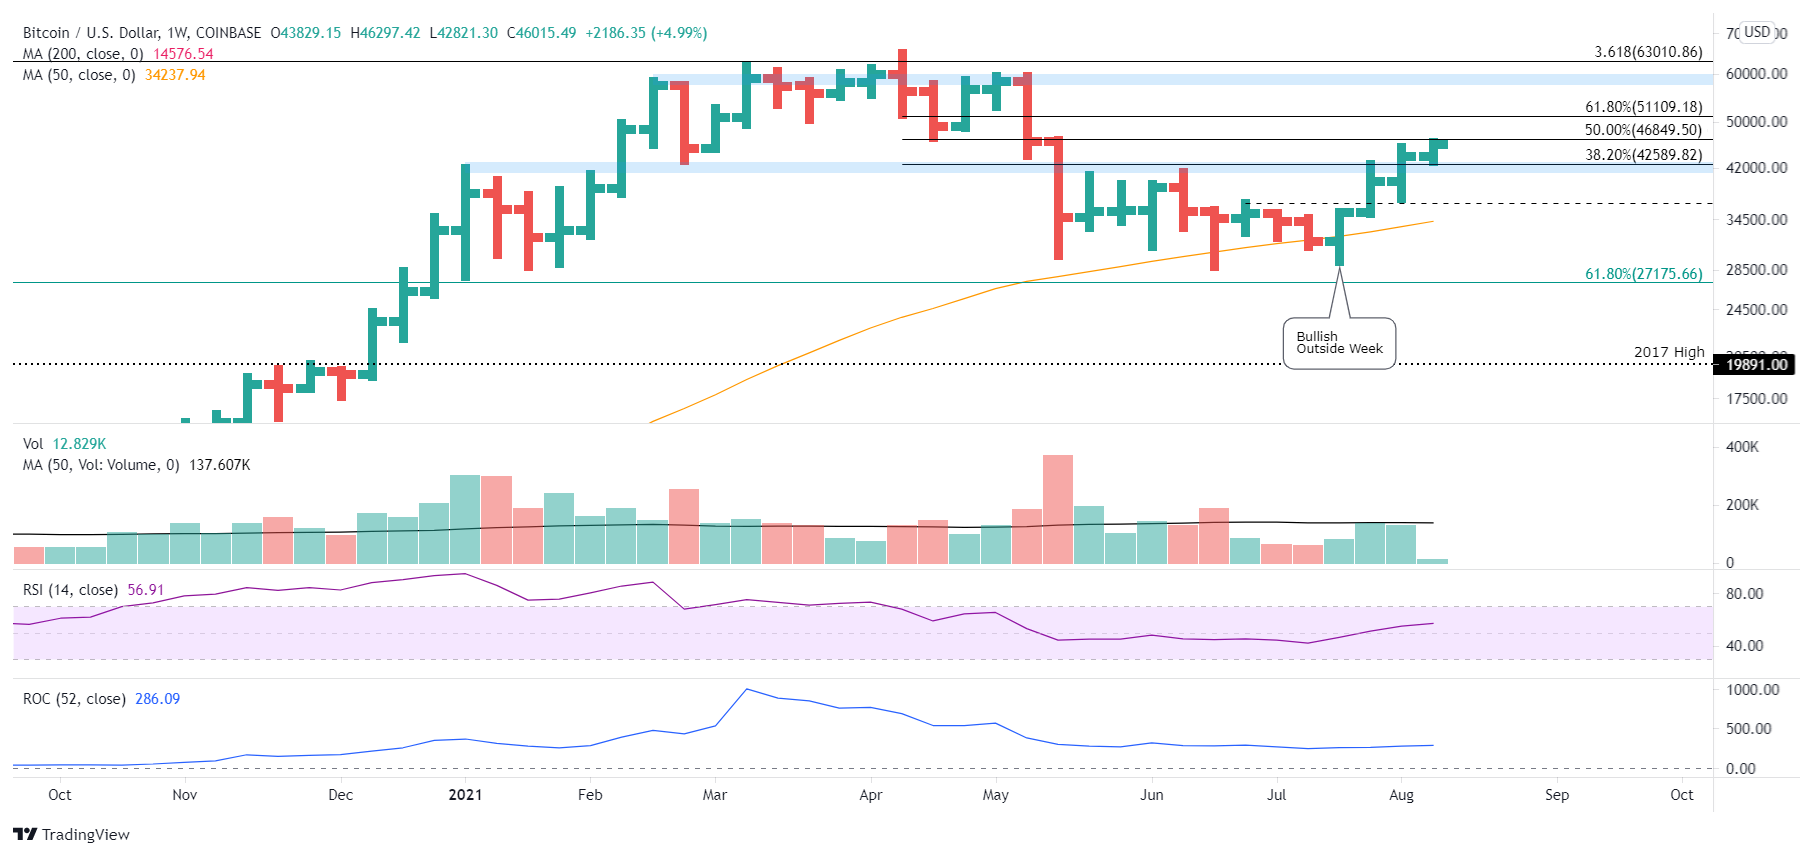
BTC/USD weekly chart
Bitcoin price cleared the trifecta of resistance of the January high of $41,322, the 38.2% retracement at $42,589 and the February 28 low of $43,016 with relative ease, establishing the range as crucial support for BTC moving forward.
Bitcoin price is now trying to clear the strategically important 200-day SMA at $44,983 with a bullish outside day on the bar charts. Beyond the 200-day SMA, Bitcoin price is primed to overcome the BTC resistance associated with the 50% and 61.8% retracement levels at $46,849 and $51,109, respectively, before discovering the next genuine resistance around $57,750.
Critical to the bullish narrative is the support granted by the previous trifecta of resistance between $41,322 and $43,016. A failure to hold leaves Bitcoin price vulnerable to a test of the June 29 high of $36,675 and potentially the 50-day SMA at $35,589.
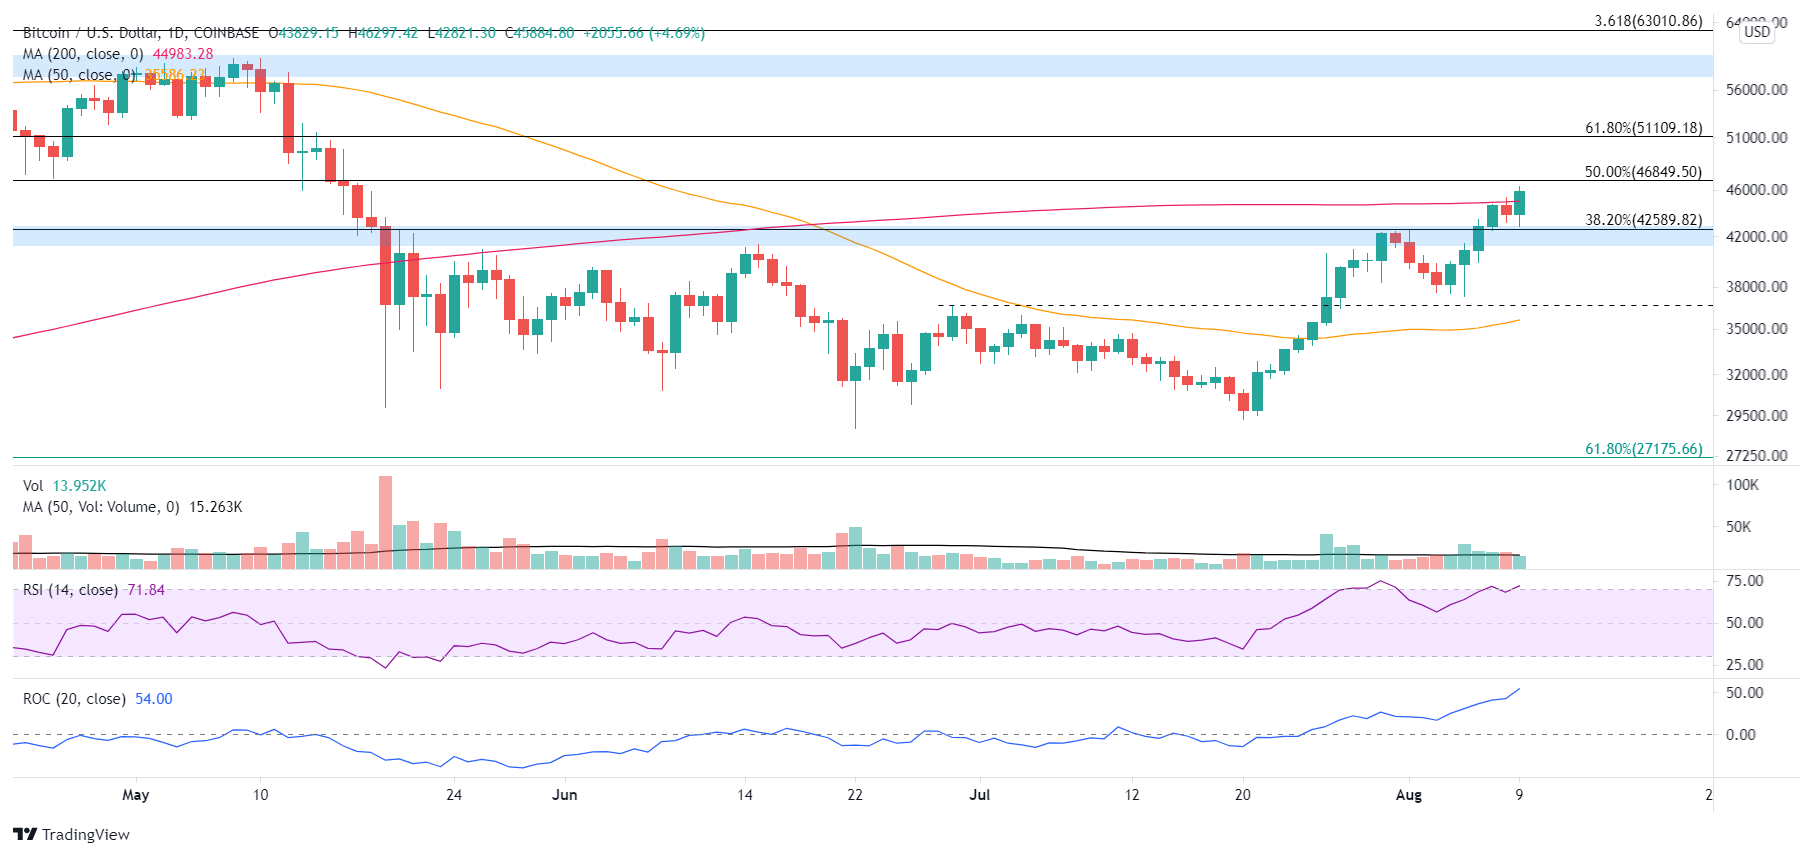
BTC/USD daily chart
If Bitcoin price does pursue a correction now, ideally, the correction is in time versus price, keeping the momentum elevated and clearing the weak holders that want to lock in profits or use the rally to break even on previously held losing positions.
Supporting a Bitcoin price correction is the Santiment Weighted Social Sentiment metric on a 30 twelve-hour smoothed basis. The moving average is now at the same level that preceded the correction in February and matched the March correction.
The Weighted Social Sentiment labels all daily coin mentions collected by Santiment as either positive, negative or ambivalent, in an attempt to visualize the average mood of the crypto community towards BTC.
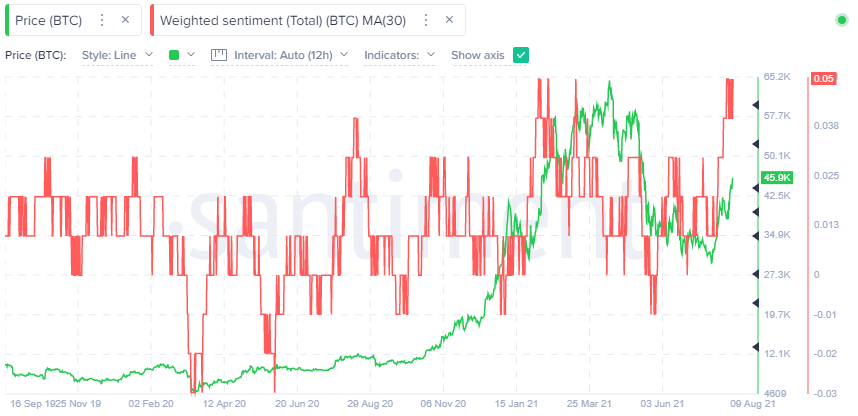
BTC Weighted Social Sentiment – Santiment
A second metric that also hints at the possibility of Bitcoin price correction is the BTC 30-day MVRV ratio. This on-chain metric attempts to quantify the average profit or loss of all addresses that have acquired BTC within a 30-day time frame.
Currently, the BTC 30-day MVRV ratio is +20.29%, suggesting that the average gain of all addresses that have acquired BTC in the last 30 days is 20.29%. The higher the ratio, the greater the uncaptured gain, thus creating a higher risk that BTC speculators will reduce their exposure.
The 20.29% reading is not at the same level as in January before the correction or before the February correction. Still, it is near the level corresponding to the November-December consolidation.
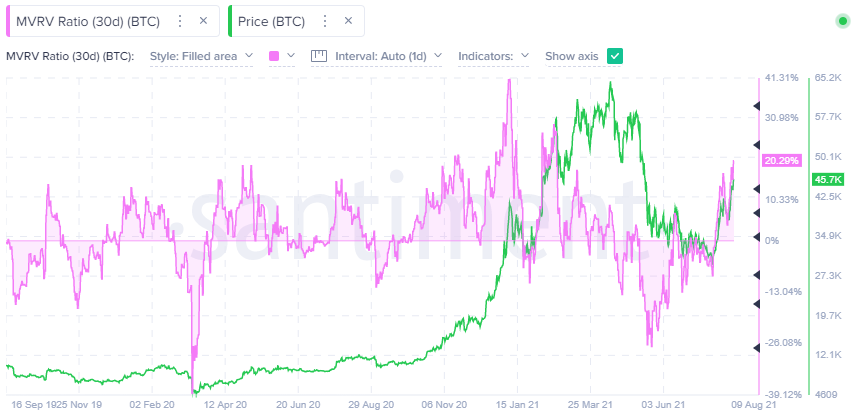
BTC 30-day MVRV Ratio – Santiment
Here, FXStreet's analysts evaluate where BTC could be heading next as it reaches a vital resistance level.


