
- Bitcoin price is declining in search of a support barrier that might kick-start a 20% rally.
- Ethereum price retraces, promptly following the pioneer cryptocurrency.
- Ripple price is heading lower to retest the range low at $0.65.
Bitcoin price seems to have undone most of its gains after June 27. This pullback occurs at the midpoint of the range, indicating that the buying pressure was insufficient. However, investors can expect this retracement to soon reverse around an immediate support level, resulting in a swift break above the range’s equilibrium. Ethereum and Ripple will most likely follow the same path as BTC.
Bitcoin price eyes higher high
Bitcoin price rose roughly 21% since June 26, but the bears seem to be bent on undoing these gains. So far, BTC has retraced nearly 10% and might decline more.
Investors can expect this correction to find a foothold at the demand zone, extending from $32,268 to $33,200. There is a high chance the drawdown will end here, considering this area’s role in pushing BTC from $32,268 to $36,600 recently. Market participants need to pay close attention to these levels.
In some cases, the sellers might extend the retracement to $31,000 and sweep below $30,000 to collect liquidity before launching to $40,000. This move would be a 32% upswing from $30,000.
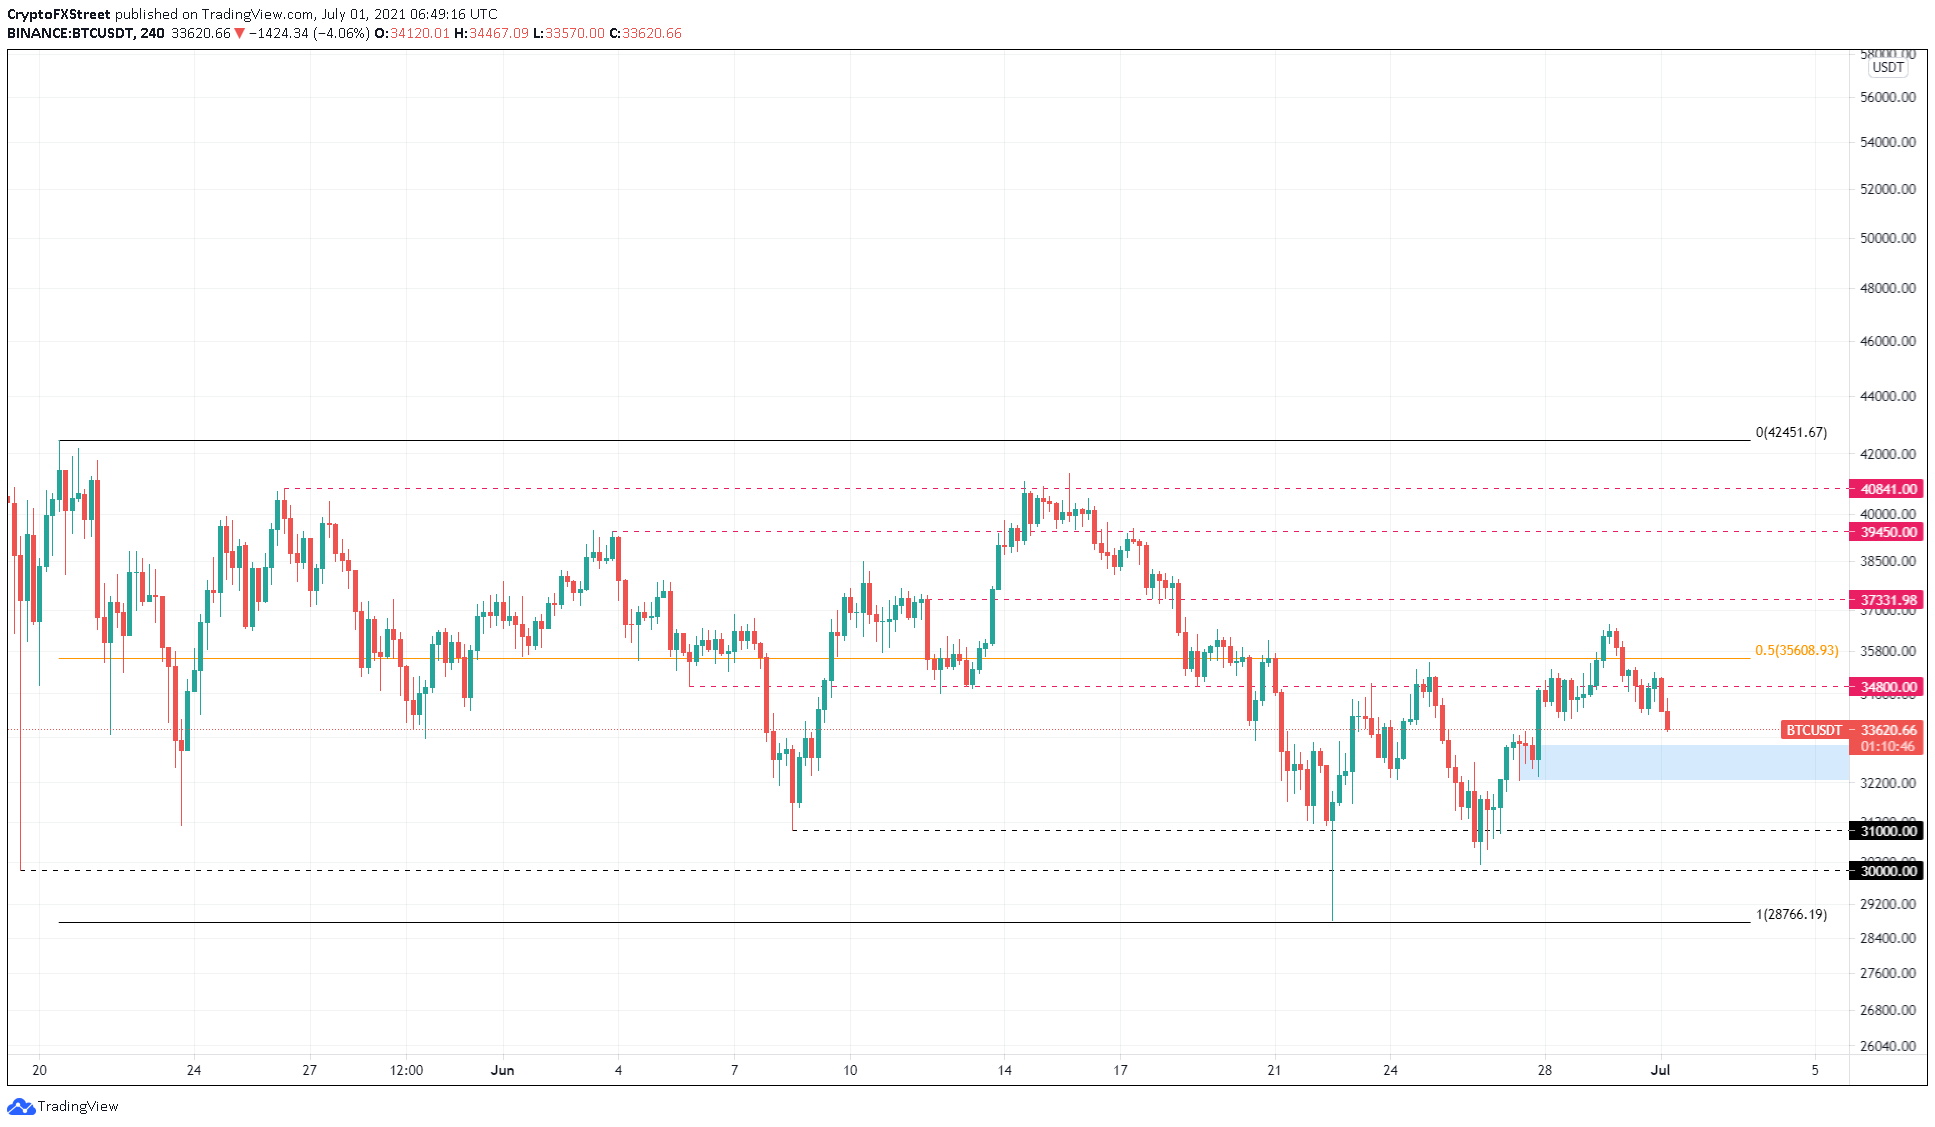
BTC/USDT 4-hour chart
While the retracement might extend to $30,000, investors need to note that Bitcoin price needs to recover quickly. A failure to do so might indicate weakness among buyers and will end the bullish thesis explained above.
In such a case, BTC might slide to the range low at $28,766.
Ethereum price scrambles to find support
Ethereum price created a higher high at $2,287 on June 30 despite BTC’s indecisiveness, suggesting that the ETH buyers have resurfaced. Currently, Ether is following the flagship crypto’s lead and is undergoing a correction.
The support barriers at $2,045 and $1,965 are likely places where this pullback might reverse. However, in a bearish case, ETH might revisit the range low at $1,804 formed on June 27.
The resulting upswing from either of the demand barriers mentioned above might push above the 50% Fibonacci retracement level at $2,320 and potentially retest the resistance ceiling at $2,460.
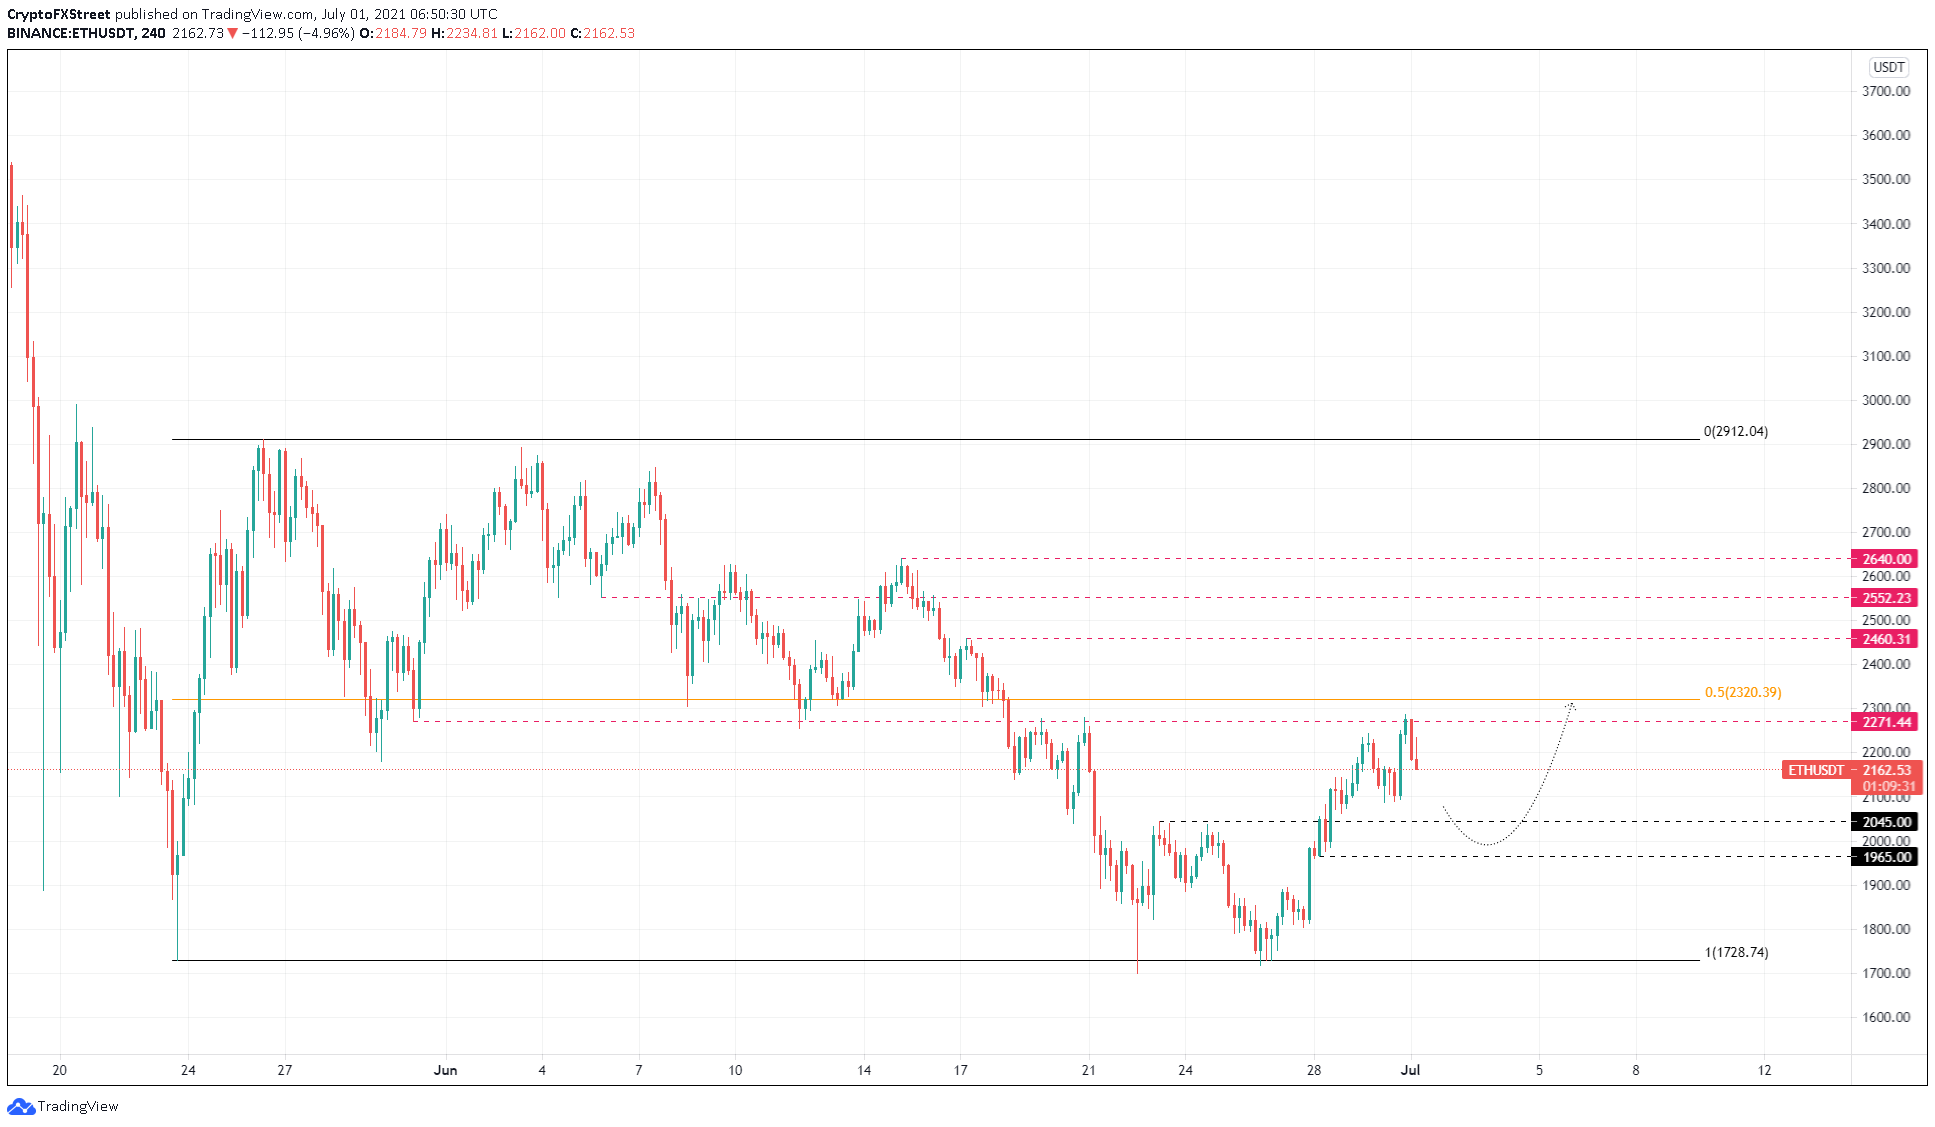
ETH/USDT 4-hour chart
Under extremely bearish circumstances, a breakdown of the range low at $1,728 will invalidate the optimistic narrative.
Ripple price shows restraint
Ripple price has rallied 44% since creating a local bottom at $0.51 on June 22 but retraced only 10% since the swing high at $0.734. Such a dynamic price action indicates that investors are actively purchasing XRP.
The retracement might extend another 10% to the support level at $0.581. However, the upswing that stems from this demand barrier could effectively pierce through intermediate resistance levels to tag the 50% Fibonacci retracement level at $0.875, which would be a 50% ascent.
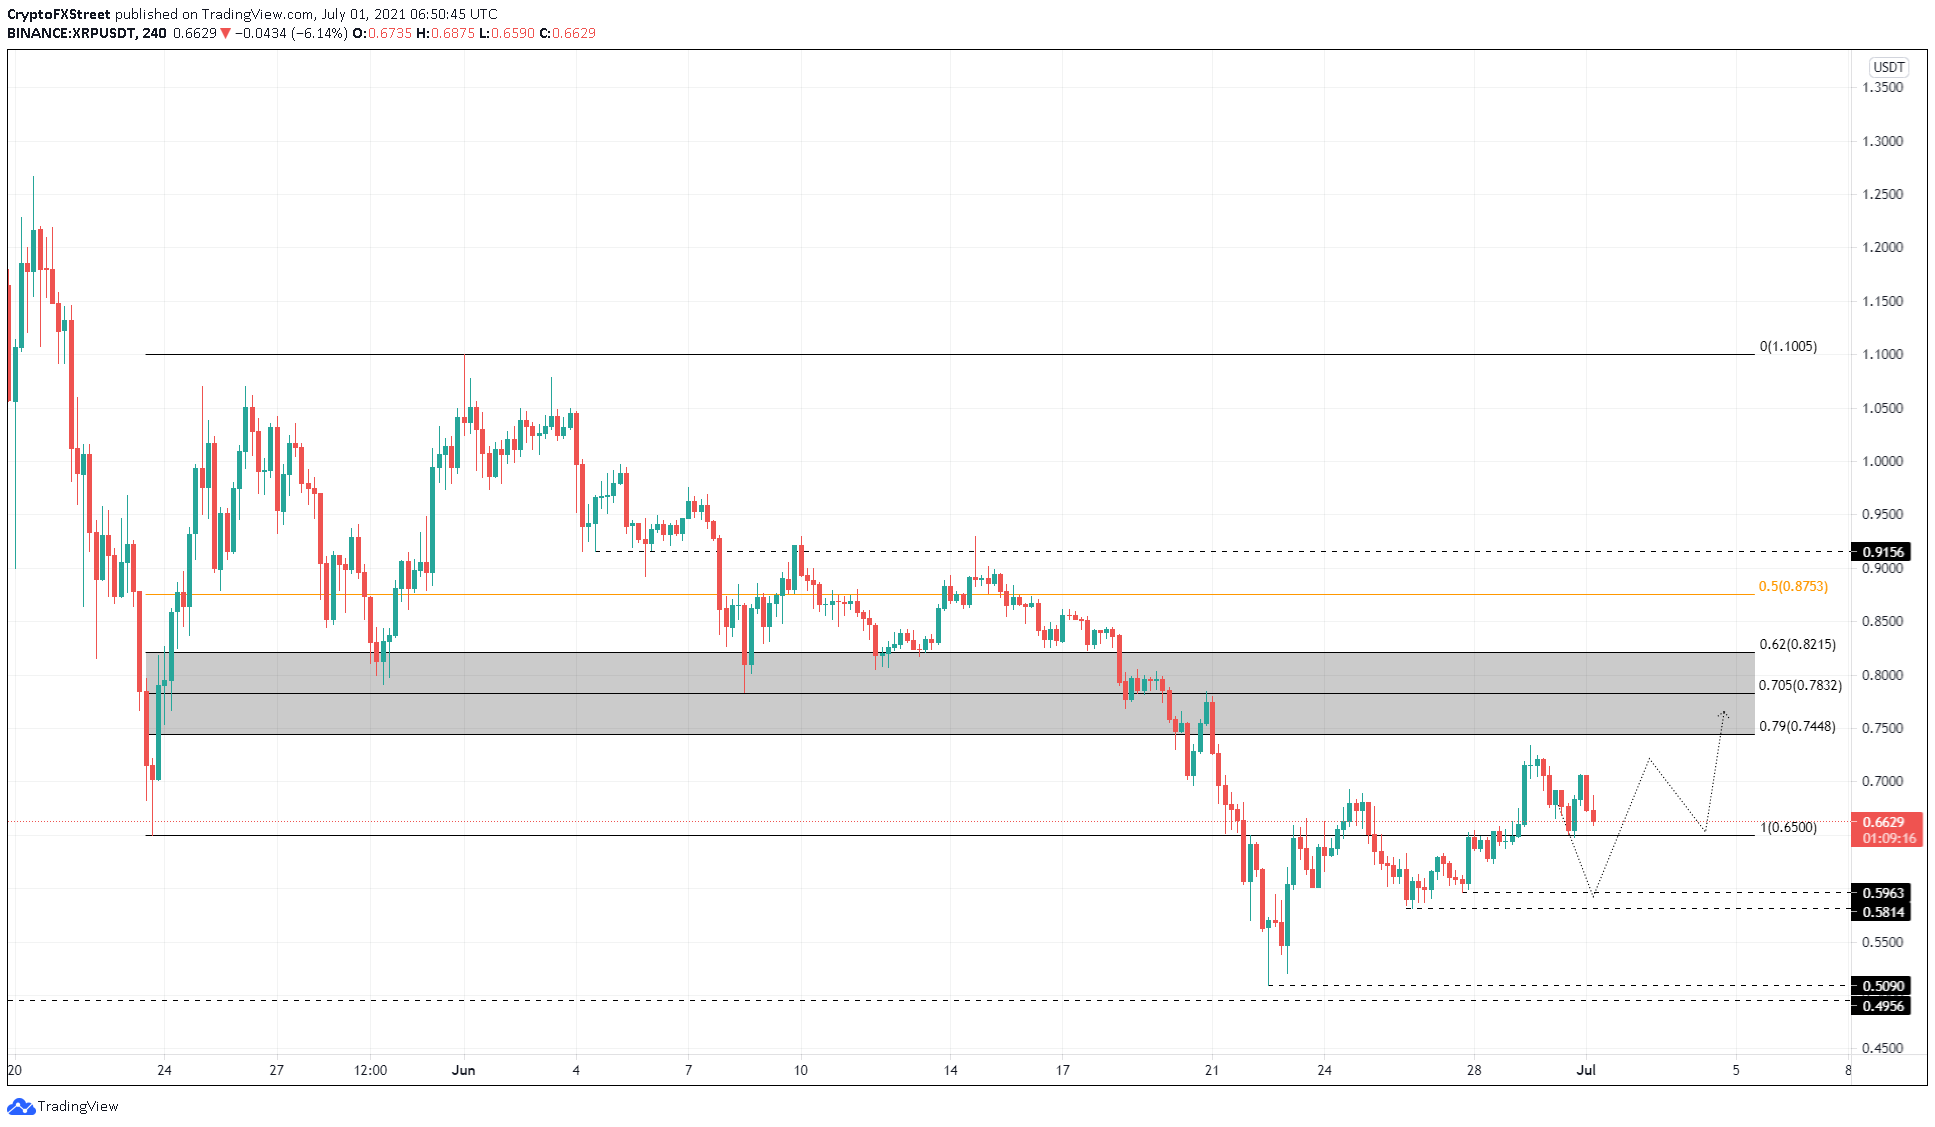
XRP/USDT 4-hour chart
Regardless of XRP price and its correlation to the flagship crypto, a breakdown of $0.734 will invalidate the bullish thesis. This move would open the possibility of a 15% downswing to $0.496.


