
- Bitcoin price learning it is not vital to the success of the cryptocurrency complex.
- Ethereum price embraces FOMO with a 110% gain over the last six weeks.
- XRP price presents a high probability entry price for traders.
Bitcoin price having trouble shaking the magnet effect of a critical intermediate-term moving average, despite broader strength in the cryptocurrency market. Conversely, Ethereum price has overcome an overbought condition on Monday to mark new all-time highs today, and XRP price releases from a bullish pattern.
Bitcoin price remains uncommitted, frustrating speculators
On April 30, Bitcoin price broke out from an inverse head-and-shoulders bottom with an 8% gain, but the price action since has been reluctant and frustrating. Part of the reason has been the 50-day simple moving average’s (SMA) stubborn role in curtailing follow-through gains. Accurately, BTC has touched the moving average every day since April 30, with Bitcoin price never getting more than 5% above.
Since the April 26 rally of 10%, Bitcoin price has achieved a paltry 9% gain, leaving it far below the performance of most of the other cryptocurrencies. Tuesday’s pullback came close to breaking below the right shoulder at $52,369 of the inverse head-and-shoulders pattern.
A resumption of the rally from the April low will find challenging resistance at the 361.8% Fibonacci extension of the 2017-2018 bear market at $63,777, a level that stymied the rally in mid-April. Further resistance is expected at the intersection of the April high of $64,899, with the wedge’s lower trend line at $65,243.
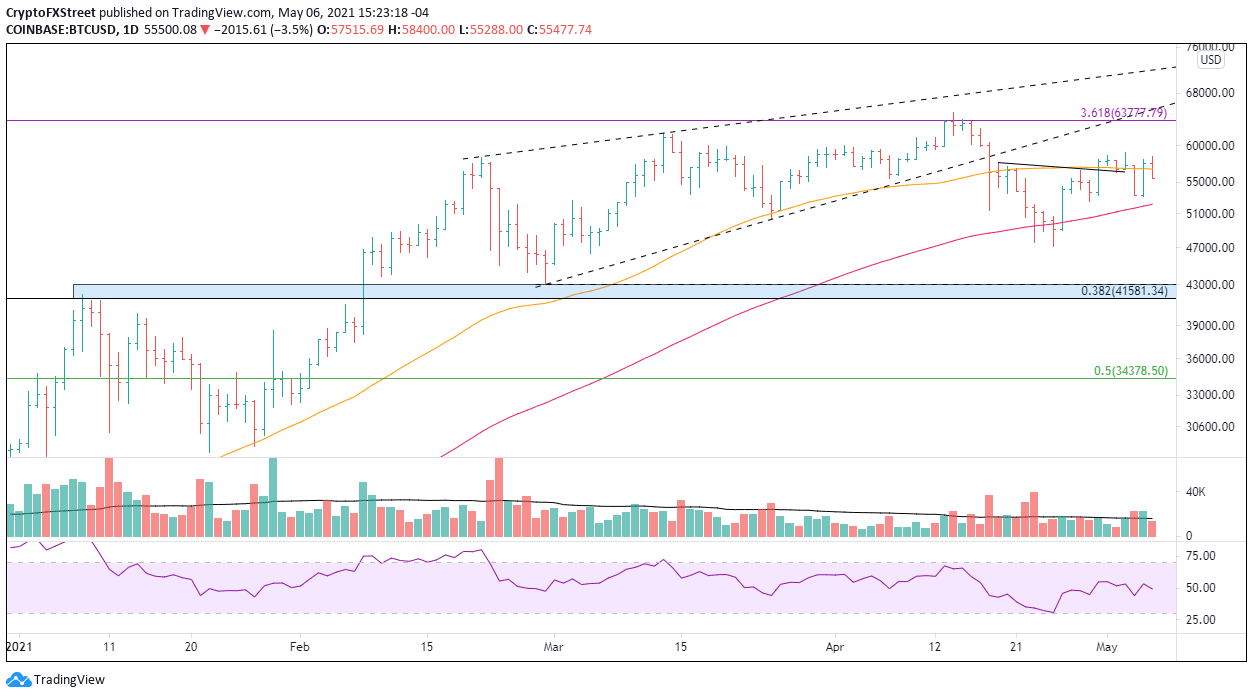
BTC/USD daily chart
If Bitcoin price falls below the right shoulder at $52,369, it would negate the mildly bullish outlook and turn attention to the support levels. The first support is the 100-day SMA at $52,157 and then the April low at $47,044. Any further weakness leaves Bitcoin price exposed to test the February low at $43,016.
Ethereum price advance reveals a troubling pattern
The ETH 6-week rate-of-change (ROC) has eclipsed 110%, and Ethereum price has tagged the 261.8% Fibonacci extension of the 2018 bear market at $3,587 with the daily Relative Strength Index (RSI) now showing a bearish momentum divergence with the price high.
Ethereum price could rally further, hitting a 6-week gain of 130%, which happened in early 2021. However, ETH has constructed a rising wedge pattern on the four-hour chart, raising the odds that the unfolding breakout from the wedge today is a bull trap.
If a reversal begins today, the initial support is the wedge’s lower trend line at $3,386. Additional support levels can be considered if the trend line is overcome with selling.
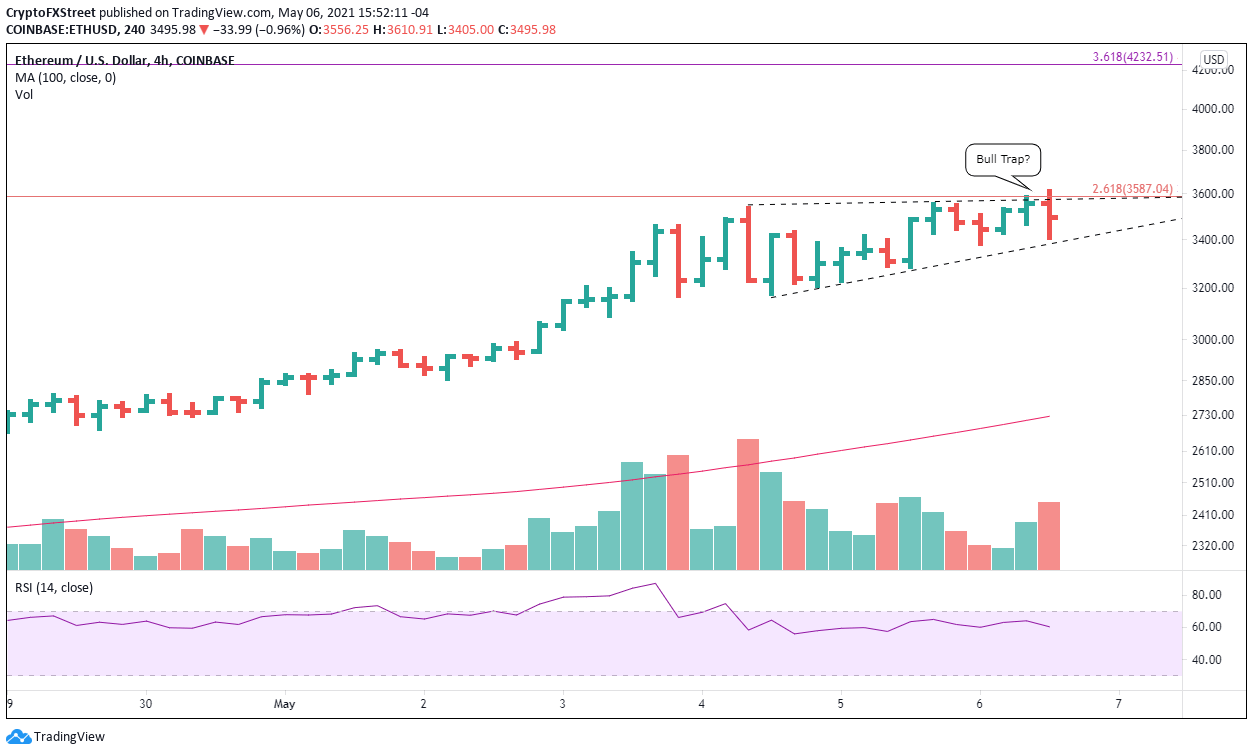
ETH/USD 4-hour chart
A strong close above the wedge on the daily chart will allow speculators to target much higher prices, potentially the 361.8% extension of the April correction at $4,232, a gain of almost 20% from the price at the time of writing.
XRP price presents a new opportunity for traders arriving late
XRP price has triggered a bullish cup-with-handle base today, offering new traders the chance to capitalize on a timely entry price. XRP price will encounter resistance at the April 13 high at $1.96, but the more significant challenges will be $2.00 and $2.08, the 61.8% Fibonacci retracement of the 2018-2020 bear market.
The measured move target of the cup-with-handle base is $3.16, yielding a gain of 90% from the handle high at $1.66. A rally of this magnitude would put XRP price within reach of the 2018 all-time high at $3.30.
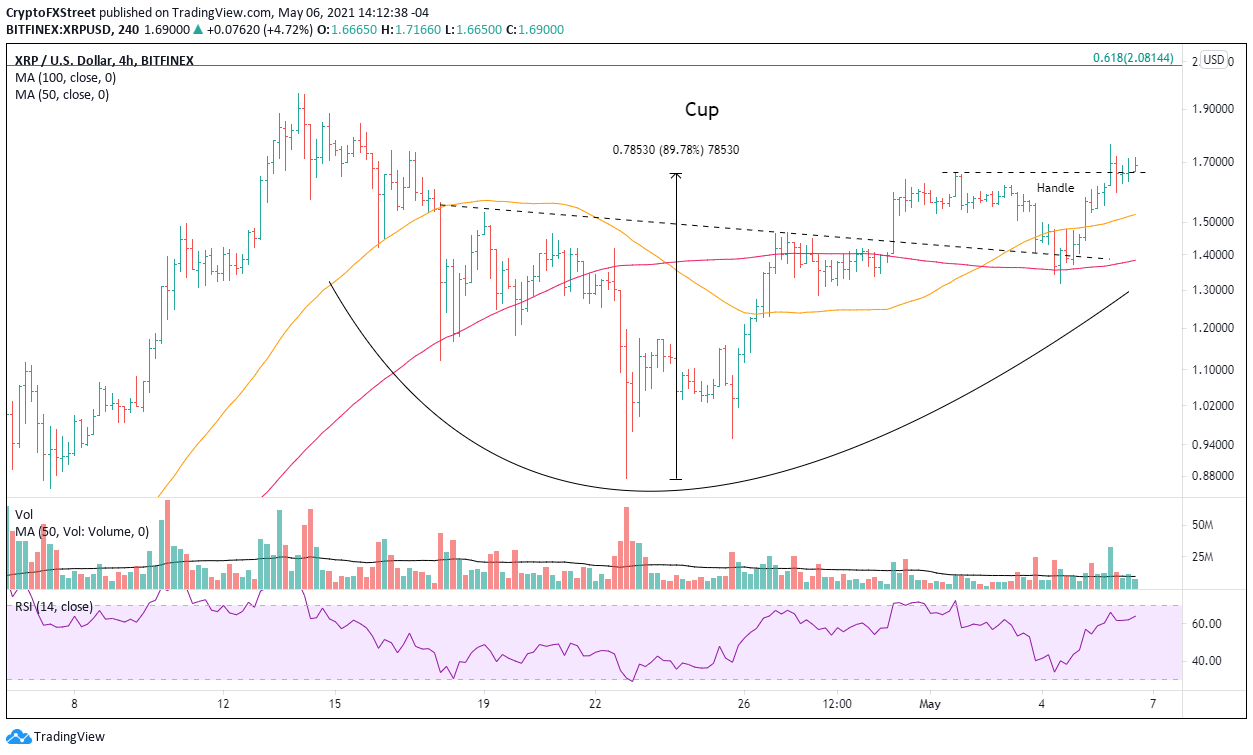
XRP/USD 4-hour chart
A decline below the handle low of $1.31 would be a warning that XRP price was vulnerable to a more significant pullback and, as a result, a more complex bottoming process.


