
- Bitcoin price rests at strategic technical level, still searching for a bottom.
- Ethereum price joins the broad selling in the cryptocurrency complex, falling 30% from peak to correction low.
- Ripple price forms symmetrical triangle but fails on first breakout attempt.
Bitcoin price has fallen 27% over the last ten days, making it the largest ten-day loss since the March 2020 collapse and the second-largest since November 2018. Amidst the heavy selling, Microstrategy Incorporated announced it acquired an "additional $10 million in Bitcoin at an average price of $43,633, lifting total holdings to 92,079 BTC for $2.251 billion with an average price of $24,450."
China cracks down on crypto transactions, citing price volatility
Today, China instituted a new ban on financial institutions and payment companies from providing services directly related to cryptocurrency transactions and specifically cautioned Chinese investors about the dangers inherent in crypto trading.
Banks and online payment channels cannot offer any service related to cryptocurrencies, such as registration, clearing, trading and settlement. Moreover, the institutions may not provide cryptocurrency products, saving and pledging services for cryptocurrencies. The ban does not stop individuals from holding cryptocurrencies.
The industry bodies behind the ban, the National Internet Finance Association of China, the China Banking Association and the Payment and Clearing Association of China, emphasized the dangers of exposing personal wealth to the volatility of cryptocurrencies, citing how easy it is to manipulate digital tokens and the perceived lack of underlying value.
Recently, crypto currency prices have skyrocketed and plummeted, and speculative trading of cryptocurrency has rebounded, seriously infringing on the safety of people's property and disrupting the normal economic and financial order.
It is not the first time China has instituted a ban on cryptocurrencies, but the timing is interesting. It is one of the clear examples of how countries are still struggling to incorporate cryptocurrencies into their regulatory framework and how there remains unease about the sustainability of the market and the potential negative consequences for the financial system's stability, particularly in periods of high volatility.
Bitcoin sentiment indicators reveal a crowded trade, but it is oversold
According to the most recent fund manager survey from Bank of America, 194 fund managers with $592 billion worth of AUM believe the "long BTC" trade is the most crowded trade again. Prior peaks in crowded trades such as technology in September 2020, US treasuries in March 2020 and the US dollar in January 2017 did loosely correlate with relative tops.
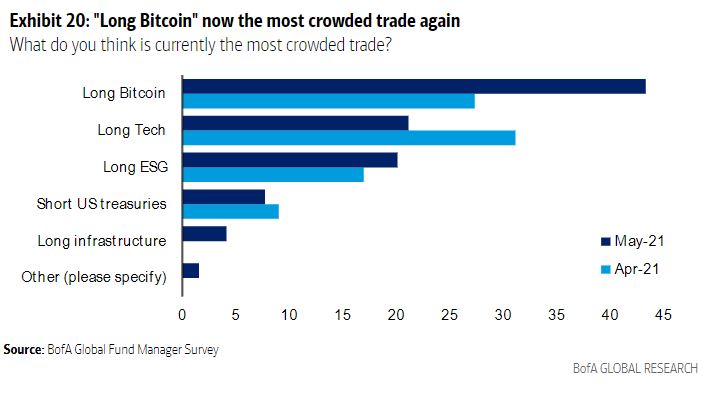
Bank of America Fund Manager Survey
The "Long BTC" topped the list in January, right before the bellwether cryptocurrency raced higher, and in 2017, another time the digital token bolted higher.
The temptation is to jump on the contrarian bandwagon, but it is important to note that sentiment indicators are a secondary instrument and not the foundation of investment decisions.
The Alternative.me Fear and Greed Index, a sentiment index for BTC and other prominent cryptocurrencies, has fallen to 21 as of today, marking a sentiment level of extreme fear. One week ago, the index was in greed territory, and a month ago, it showed extreme greed.
It is the lowest reading since April 2020, but 10 points above extreme fear readings reached in March 2018, November 2018, August 2019 and April 2020, suggesting fear could rise more in the short term.
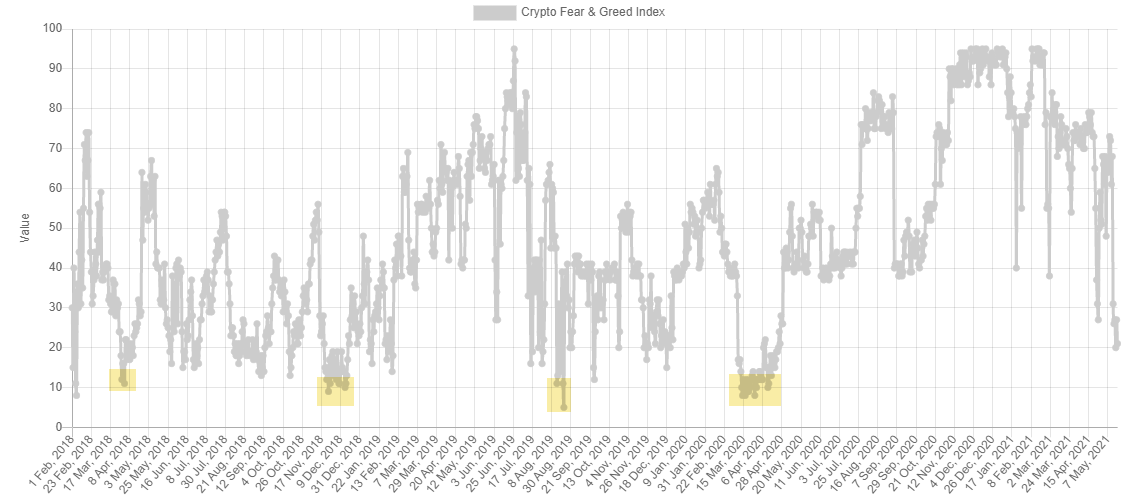
Alternative.me Crypto Fear & Greed Index
Bitcoin price tests conviction levels
Bitcoin price rests at a critical juncture as sentiment reaches extreme fear. The critical level is the convergence of the neckline of a head-and-shoulders top with the support framed by the January high at $41,986 and the February low at $43,016, and the 38.2% Fibonacci retracement level of the advance beginning in May 2020.
The expected target for the current BTC decline is the 50% retracement of the rally since March 2020 at $34,378, which coincides closely with the head-and-shoulders measured move target of $33,400.
The lack of buying pressure at current levels suggests that Bitcoin price may extend the decline to the targets mentioned earlier, likely in a panic sell-off that will culminate with a bullish hammer candlestick and a similar sentiment reading as seen in April 2020. Standing in front of the target is the 200-day simple moving average (SMA) at $39,694.
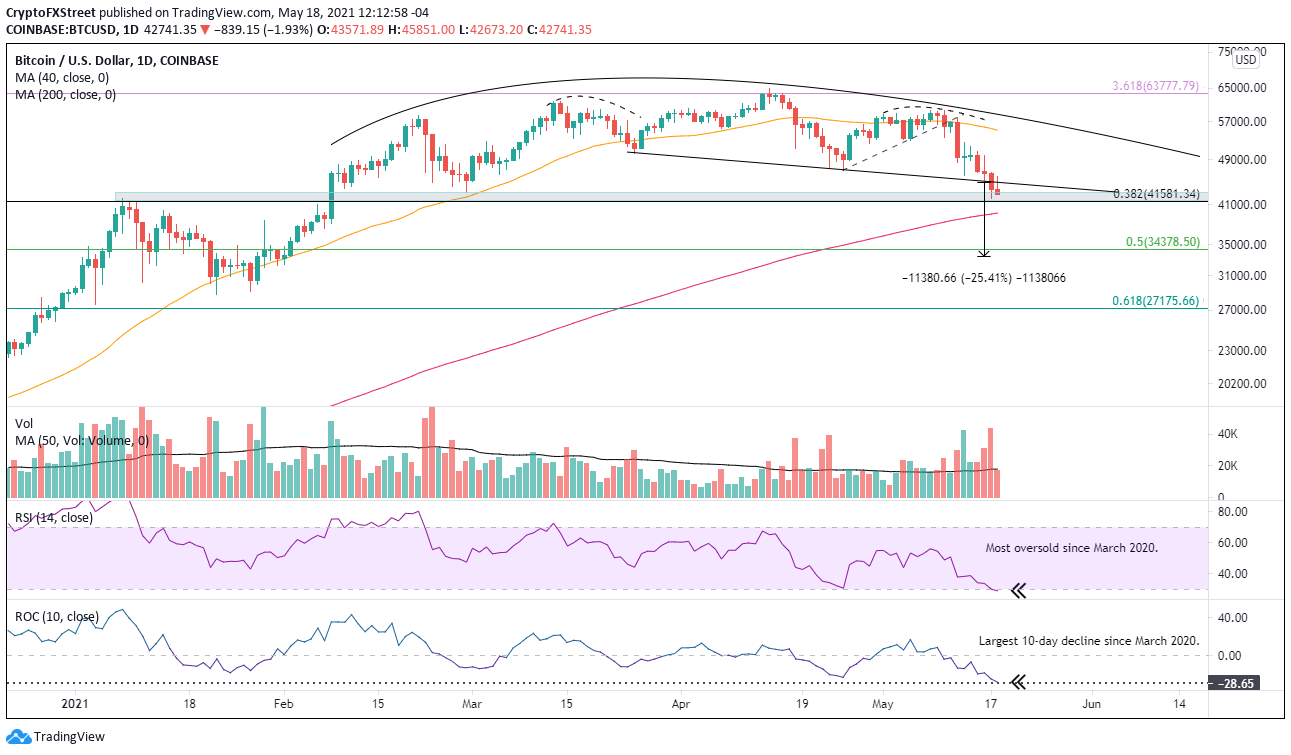
BTC/USD daily chart
It would not be a surprise to see Bitcoin price try to rebound from the current price level, considering that it has registered the second-largest 10-day decline since November 2018, and the daily Relative Strength Index (RSI) has now reached an oversold condition. Any bounce will struggle with the April 25 low at $47,044, but if successfully overcome, bears need to be cautious because BTC could jump to the declining 50-day SMA at $57,040.
Ethereum price holds key Fibonacci level
Ethereum price displayed superior relative strength in April while the cryptocurrency market suffered heavy selling, building the basis for a 120% rally from the April 18 low at $2,000 until the May 12 high at $4,384.
This month's selling proved too challenging to overcome, and Ethereum price has fallen to the 38.2% retracement of the rally beginning the end of February, representing a 30% decline in six days.
If the selling in the crypto complex continues, Ethereum price will likely test the rising 50-day SMA at $2,923 and the 50% retracement level at $2,838.
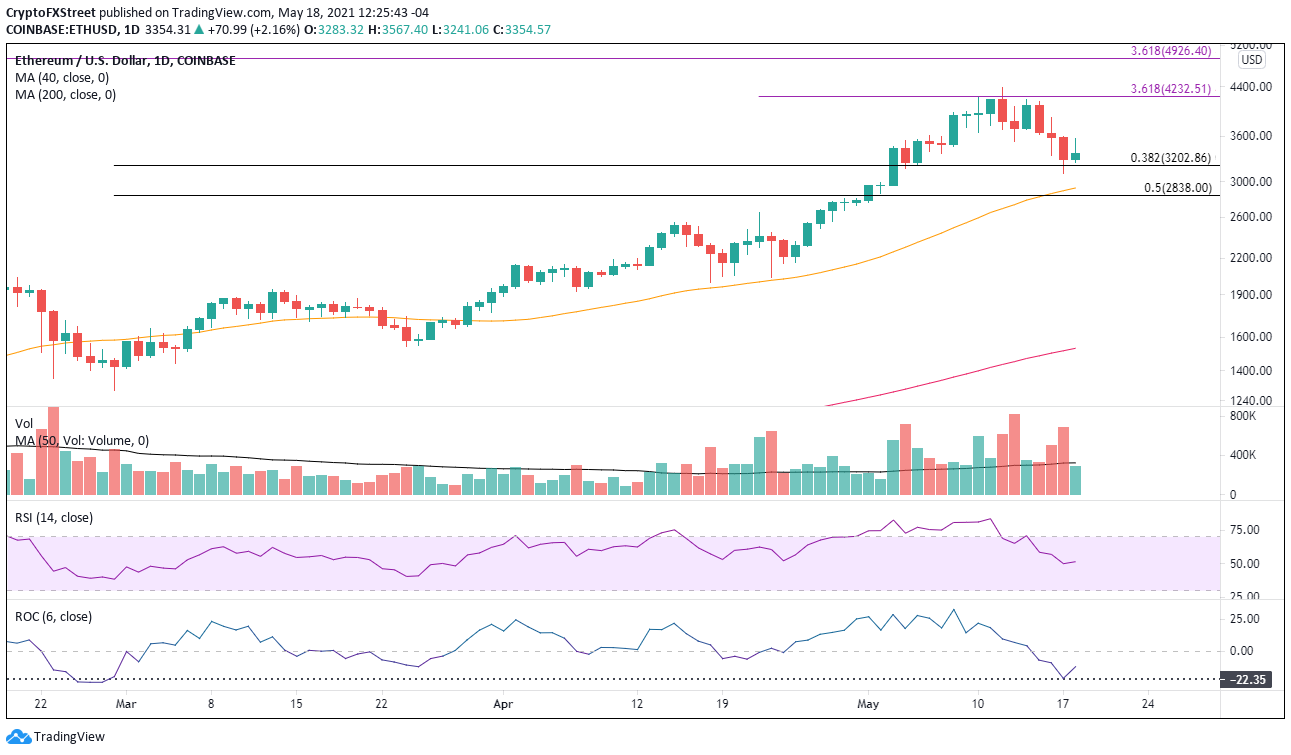
ETH/USD daily chart
On the other side of the fence, if Ethereum price begins to show renewed relative strength as the broader market slides, it would signal that the smart contracts token is readying for a test of the all-time high at $4,384.
XRP price bounces in a slow market
XRP price has delivered a challenging trading environment since the Apri high, but the charts are beginning to clarify the notable volatility into a wide symmetrical triangle pattern. Today, Ripple tried to release from the triangle but was quickly rejected.
XRP price needs to close above $1.76 to confirm a new bullish outlook for the international settlements token.
Immediate resistance upon breakout will be the April high at $1.96, followed closely by the psychologically important $2.00 and the 61.8% Fibonacci retracement of the 2018-2020 decline at $2.08. Combined, the three levels present a formidable challenge for the bullish XRP price narrative.
A successful rally above the area of $2.00 puts XRP price in an excellent position to test the 78.6% retracement of the 2018-2020 decline at $2.61, a gain of 70% from price at the time of writing.
The potential of a positive resolution to the SEC case with Ripple, combined with rumors of an IPO following the case, has many investors focused on the all-time high at $3.30. This year, other cryptocurrencies have been proven that all-time highs can be a powerful magnet for price.
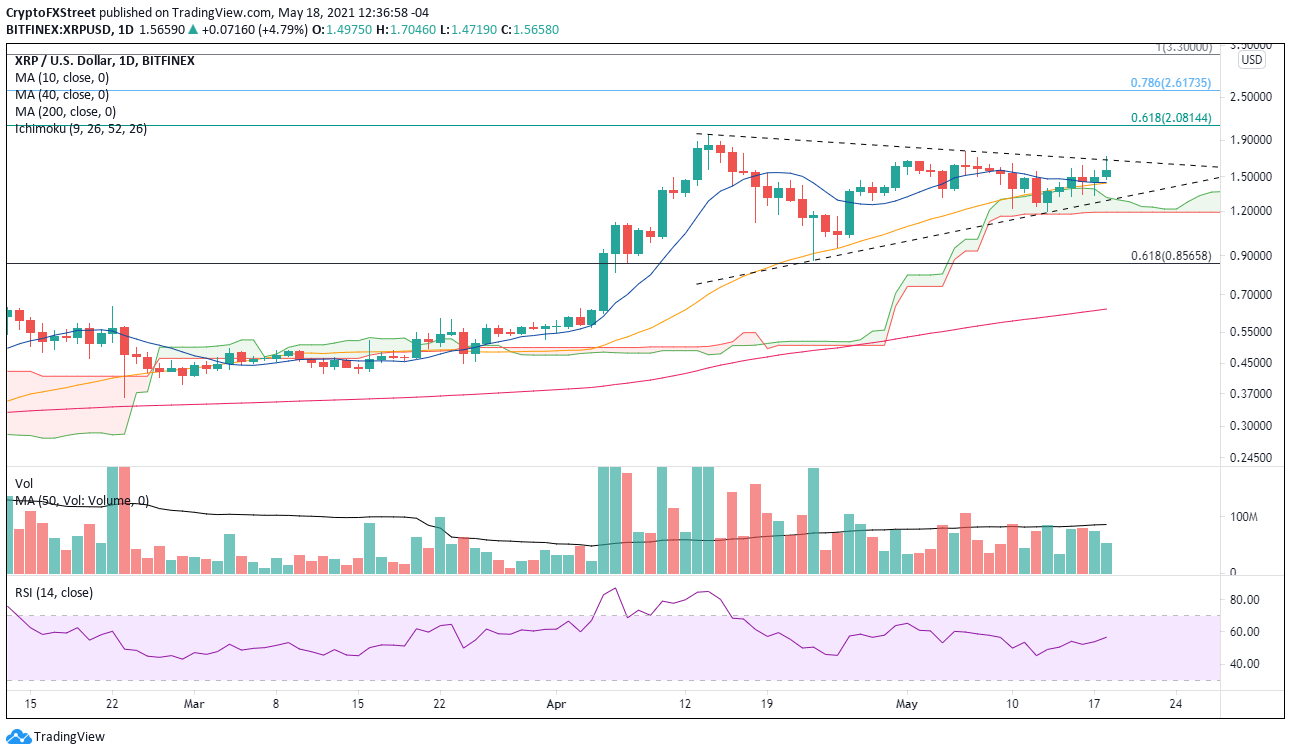
XRP/USD daily chart
The bearish alternative for Ripple begins with a break below the triangle's lower trend line at $1.30 and the Ichimoku Cloud. Still, the downside could be limited by the tactically important 10-week simple moving average (SMA) at $1.16 and the critically important $1.00.


