
- Bitcoin price is on pace for the best day since June 13 but remains down 8% for July.
- Ethereum price staging a rebound of 12% from the dominant support framed around $1,700.
- XRP price up 10% today after striking an oversold reading on the daily Relative Strength Index (RSI).
Bitcoin price leads a broad-based rally for the cryptocurrency complex after several altcoins reached an inflection point yesterday. It is an interesting evolution of the price action this month, but it does not definitively remove the downward bias that has been tormenting cryptocurrency investors in July. Confirmation of a trend change will come with follow-through for Ethereum and Ripple over the next few days as former resistance levels are overcome on a daily closing basis.
Bitcoin price masters support with bullish outcomes now possible
Bitcoin price builds on early gains as FOMO overtakes the cryptocurrency market after an enduring decline from the early July highs. The rebound has lifted BTC above the psychologically important $30,000 and towards the resistance marked by the confluence of the 50-week simple moving average (SMA) at $32,277 with the falling wedge’s upper resistance line around $32,800.
The falling wedge pattern is a bullish development for BTC after weeks of price churn around $30,000. It implies declining downside momentum and the potential for a sharp, convincing rally upon breakout.
To ignite a sustainable rally, Bitcoin price needs to log a daily close above the 50-week SMA at $32,277, the falling wedge’s upper resistance line at $32,800 and finally, the 10-week SMA at $34,873. The 10-week SMA invites a big challenge as BTC has not closed above the moving average on a weekly basis since the beginning of May.
Above $34,873, Bitcoin price will be primed to track down the resistance around the 38.2% Fibonacci retracement of the April-July correction at $42,589. The level closely matches the January high of $41,986.
Based on the measured move of the falling wedge, Bitcoin price will dismantle the resistance around the Fibonacci retracement and reach a price target of $46,300, or a gain of 40% from the pattern breakout. The BTC target correlates closely with the high of the crash week in May at $46,646.
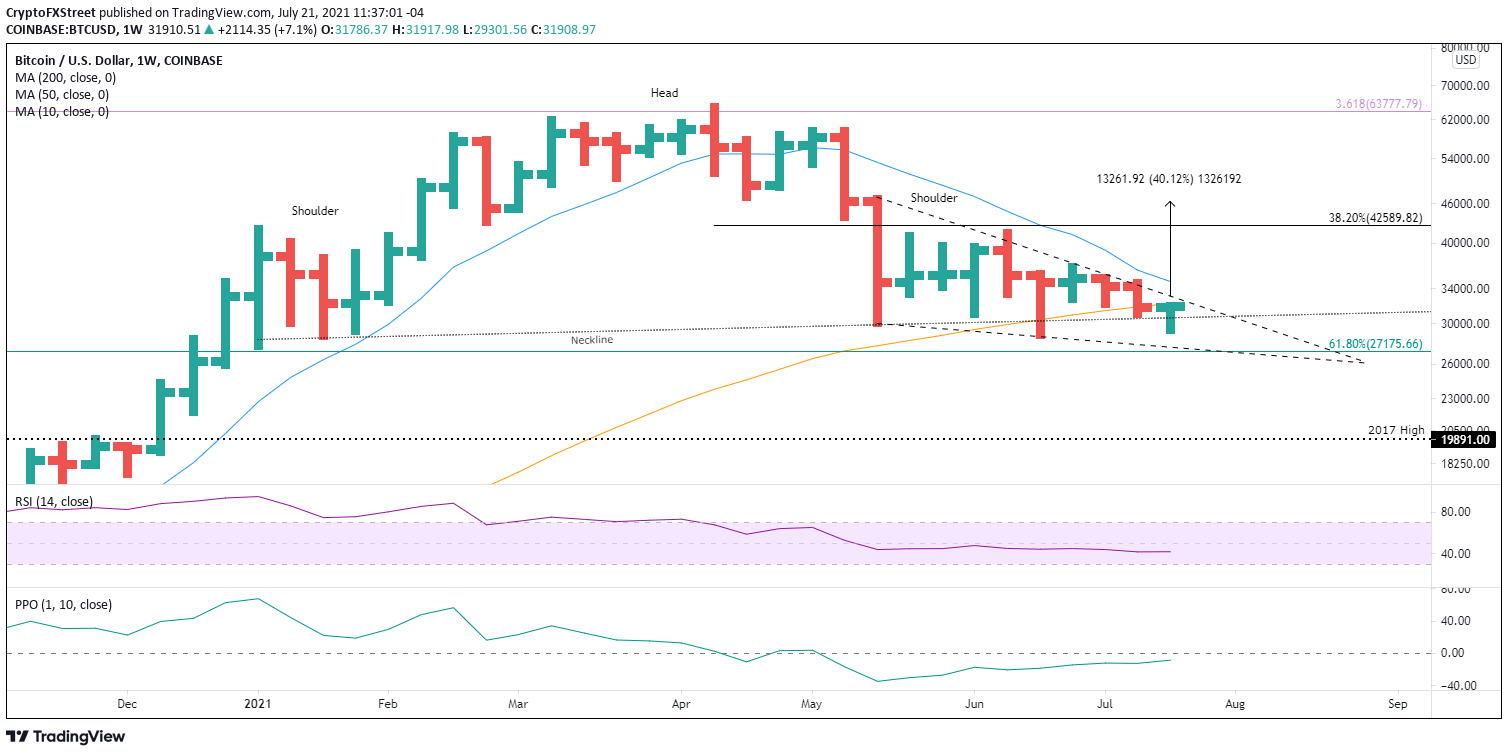
BTC/USD weekly chart
On the downside, Bitcoin price needs to hold the falling wedge’s lower support line around $27,670 and the 61.8% retracement level of the advance beginning in March 2020 at $27,175, on a daily closing basis.
A BTC failure to hold the levels could extend the correction to the 2017 high at $19,981 if the cryptocurrency market reverts lower on heavy selling.
Here, FXStreet's analysts evaluate where BTC could be heading next as it seems bound for a rebound before capitulation.


