
- Bitcoin price locates healthy support at the 12-month simple moving average (SMA) before resuming the current advance.
- Ethereum price respects 61.8% Fibonacci retracement for three consecutive months before launching the new cyclical bull market.
- XRP price fails to capture support at the neckline of an inverse head-and-shoulders pattern but eventually strikes a low at the 78.6% retracement.
Bitcoin price, Ethereum and XRP have engaged various strategic support and resistance levels since the March 2020 low. Each carving out a unique price structure that projects bullish outcomes for the major cryptocurrencies in the months ahead.
Bitcoin price holds secular advance in a period of turbulence
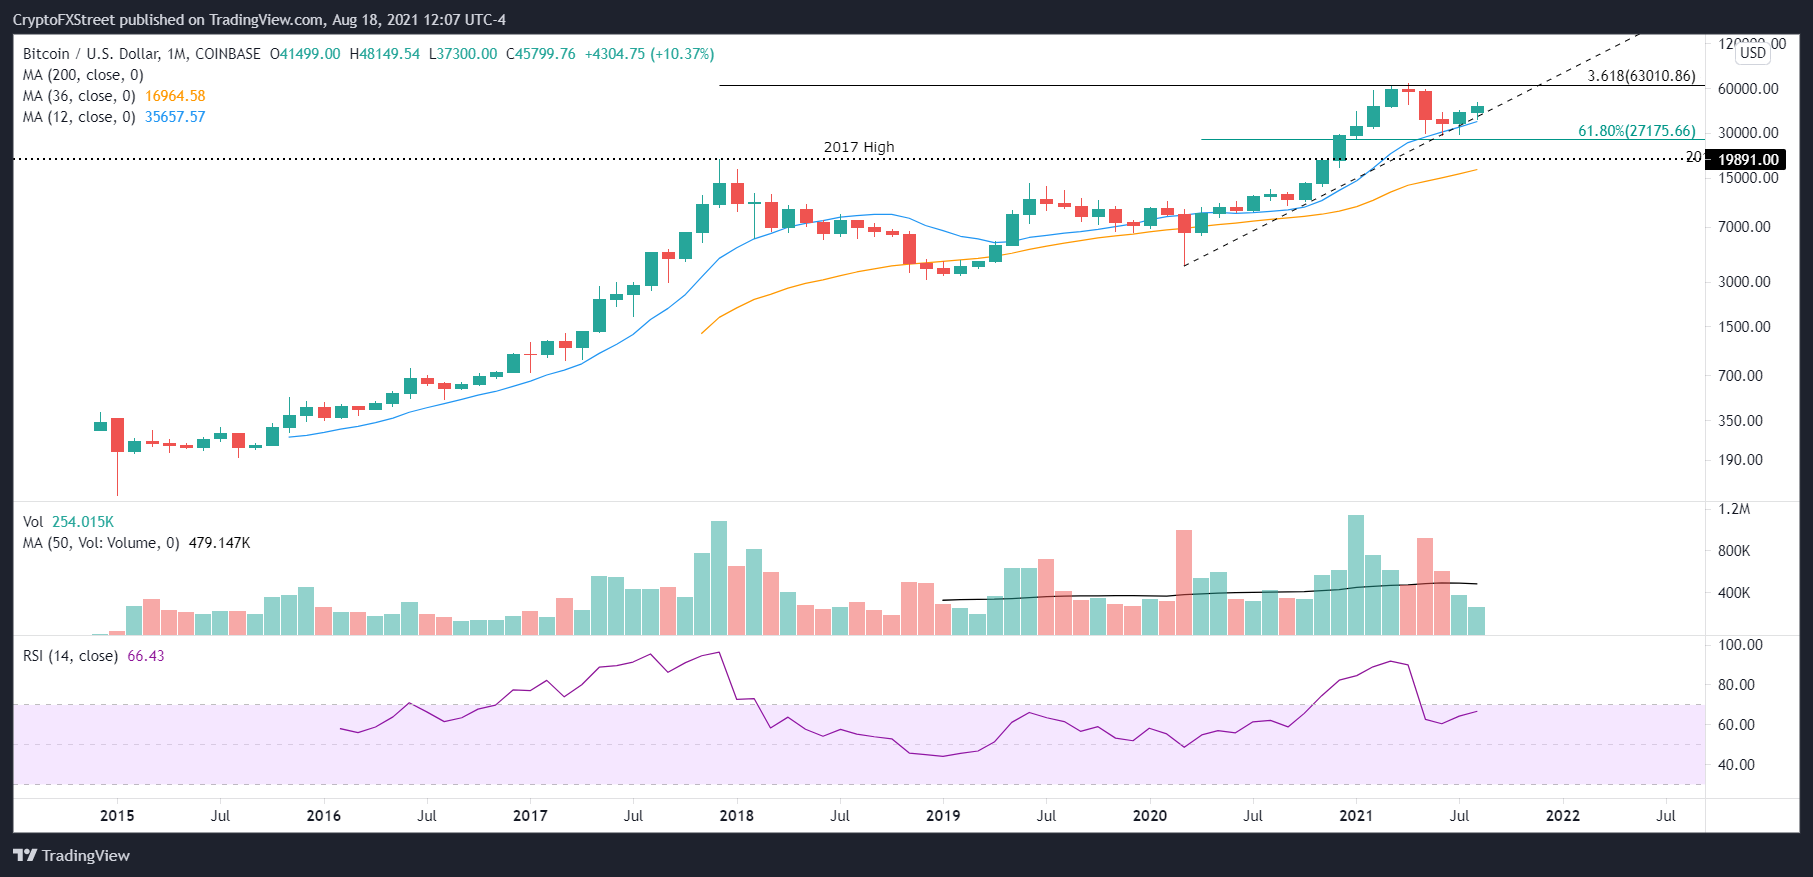
Bitcoin price climbed over 900% from the March 2020 close until the April high, featuring only three negative months, June 2020 and September 2020. In April, the advance concluded with a Doji candlestick pattern on the monthly chart after BTC briefly surpassed the 361.8% Fibonacci extension of the 2017-2020 correction.
The doji candlestick marked a point of exhaustion and indecision as Bitcoin price tested a tactically important resistance level in the 361.8% extension. The result was the largest monthly decline since November 2018, highlighted by a crash on May 19.
The May low nearly struck the 12-month SMA until it rebounded, but Bitcoin price did activate the support of the moving average in June and July. Moreover, BTC tested the ascending trend line from March 2020 low and the 61.8% retracement of the 2020-2021 advance. The result was an 18% gain in July that has followed through into August while still respecting the guidance of the ascending trend line.
As long as the tend line and 12-month SMA are not broken on a monthly closing basis, the secular advance from the March 2020 low will remain live, sending Bitcoin price above the 361.8% extension and the all-time high of $64,899.
BTC/USD monthly chart
A failure to hold the 2020 ascending trend line and the 12-month SMA on a monthly closing basis will shift the BTC focus on the support granted by the 61.8% retracement at $27,715 and then the 2017 high of $19,891.
Here, FXStreet's analysts evaluate where BTC could be heading next as it looks primed to retrace.


