
- Bitcoin price momentum continues to fade on the intra-day charts, projecting a break to the downside at any time.
- Ethereum price is now entangled with the tactically important 50-day simple moving average (SMA).
- XRP price trades with no intention, forms new channel along $0.65 with major technical obstacles above.
Bitcoin price has been unable to fulfill expectations of a meaningful rally after triggering a multi-month head-and-shoulders pattern. Meanwhile, Ethereum price shows exhaustion and may be near a significant decline. XRP price remains unchanged, offering few clues as to directional intentions.
Tesla to feel the effects of a challenging quarter for Bitcoin
Bitcoin price closed the 2Q down over 40%, marking the worst quarter since 4Q2018. The impact of the substantial loss will extend beyond the retail and institutional investors, hitting publicly traded companies like Tesla, which took on a $1.5 billion Bitcoin position earlier this year.
Tesla announced their initial investment in Bitcoin in February when the cryptocurrency was trading in the range of $32,000-$33,000.
It is anticipated that Tesla will announce in their quarterly report to investors that the impairment cost associated with the Bitcoin position will be between a $25 million and $100 million loss.
According to CNBC technology reporter Kate Rooney, the impairment charge will happen due to existing accounting practices.
Tesla holds crypto as an intangible asset, and because of the accounting rules, when Bitcoin’s value drops below a certain amount, companies have to mark that down in their financial statements.
Moreover, Tesla cannot mark up the price of Bitcoin until the company executes a sale of the position.
Despite the Bitcoin investment being at a loss, Elon Musk has reiterated that the company has no plans of selling the position in the foreseeable future.
Bitcoin price searches for a committed bid, but still in hibernation
Bitcoin price has failed to engineer a compelling rally from the June 22 correction low of $28,800, despite the formation of a weekly hammer candlestick pattern and the accompanying bullish momentum divergence highlighted on the daily BTC Relative Strength Index (RSI).
Bitcoin price bounce has plotted a rising wedge pattern with the most recent leg higher showing no impulsiveness or sustainability, creating a new descending trend line that may provoke a BTC dip towards the psychologically important $30,000.
A close below the rising wedge’s lower trend line and the 50 six-hour SMA at $34,308 will be the first confirmation that Bitcoin price is readying to revisit the correction lows. A decline below $32,703 will be the final confirmation.
With momentum waning and the declining 50-day SMA at $36,000 pressing down on Bitcoin price, the probabilities indicate that the risk is to the downside in the short term.
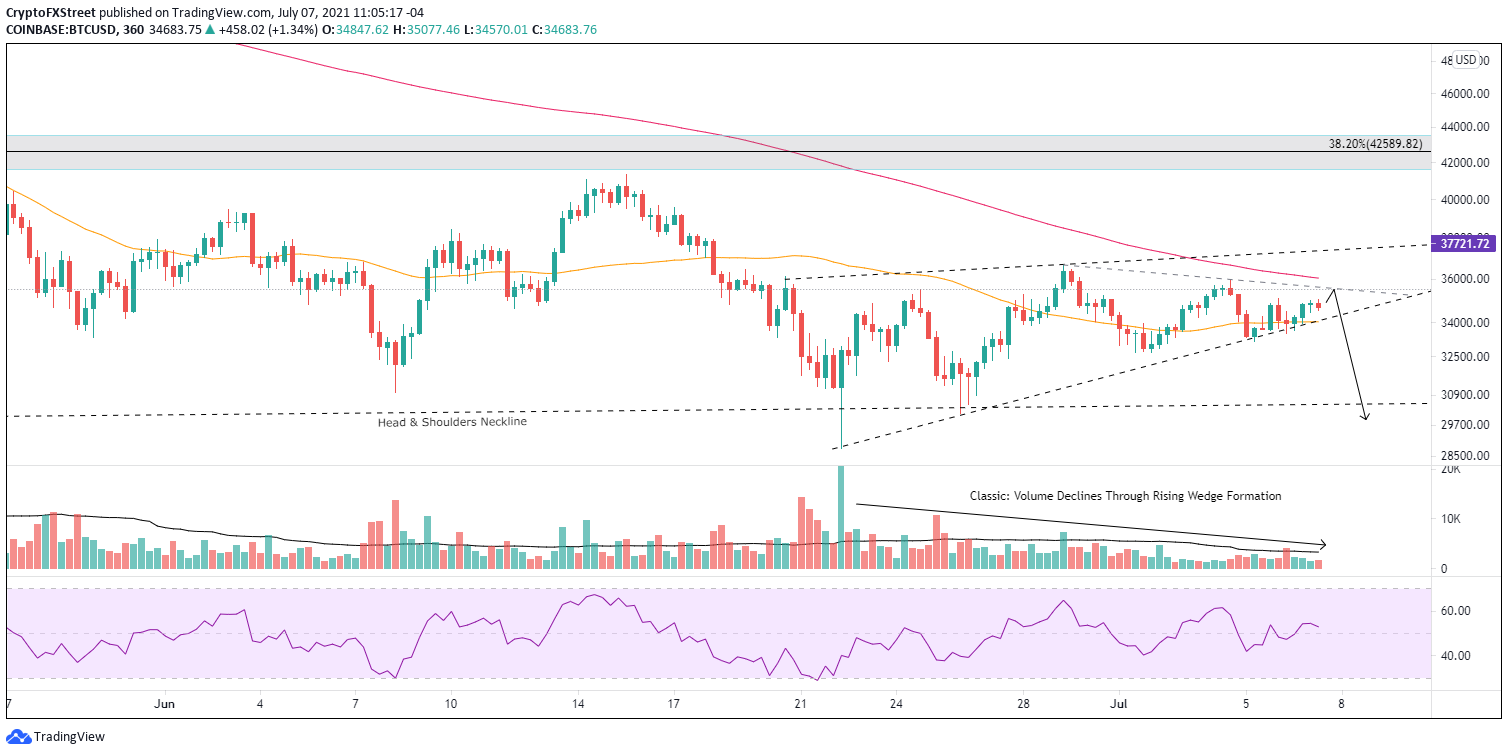
BTC/USD 6-hour chart
A close above the 200 six-hour SMA at $36,057 would negate the bearish projection and position Bitcoin price for a test of the rising wedge’s upper trend line, currently at $37,370. However, BTC will still need to engage formidable resistance at the Anchored VWAP from October 21, 2020 at $37,724 before the flagship cryptocurrency can reach the critical resistance at $42,500.
Here, FXStreet's analysts evaluate where BTC could be heading next as it seems bound for a correction before higher highs.


