
- Bitcoin price beats the psychologically important $50,000, but a momentum divergence on the daily chart persists.
- Ethereum price prints new rally highs with the 61.8% Fibonacci retracement at $3,358 now in play.
- XRP quietly emerges from a symmetrical triangle continuation pattern on the intra-day charts, targets a 20% gain.
Bitcoin price closes with five consecutive positive weeks for the first time since November 2020 and is now up 20% for the month. Ethereum price was unable to log a fifth straight up week, but it is still up 31% for the month and 45% for Q3. XRP price closed last week down -4.52%. Since mid-July, it was the first negative weekly performance, but Ripple is still up 65% for August and 75% for 3Q.
Bitcoin price reaches milestone
Bitcoin price ended the brief pullback on August 19 with a bullish outside day and a close above the 200-day simple moving average (SMA) and the 2020 ascending trend line. BTC has continued the momentum with a surge into a new rally high and a test of $50,000, showing a 70% gain from the July 20 low.
During the July 20 low rally, a bullish theme has been the number of bullish outside days on the daily chart. There have been four, July 30, August 5, August 9 and August 19. Three of the four have emerged when Bitcoin price nears a short-term support level. It confirms the strength of the underlying bid when there is weakness.
Today’s jump above $50,000 increases the probability that Bitcoin price can rally to the 78.6% retracement at $57,173 before engaging fierce resistance shaped by the February, April and May highs. At that level, BTC investors can anticipate a deeper pullback and consolidation.
A bearish BTC factor that could interrupt the Bitcoin price journey higher is the persistence of the bearish momentum divergence on the daily Relative Strength (RSI), despite the new highs. A bearish momentum divergence occurs when the RSI does not confirm new price highs with a new high.
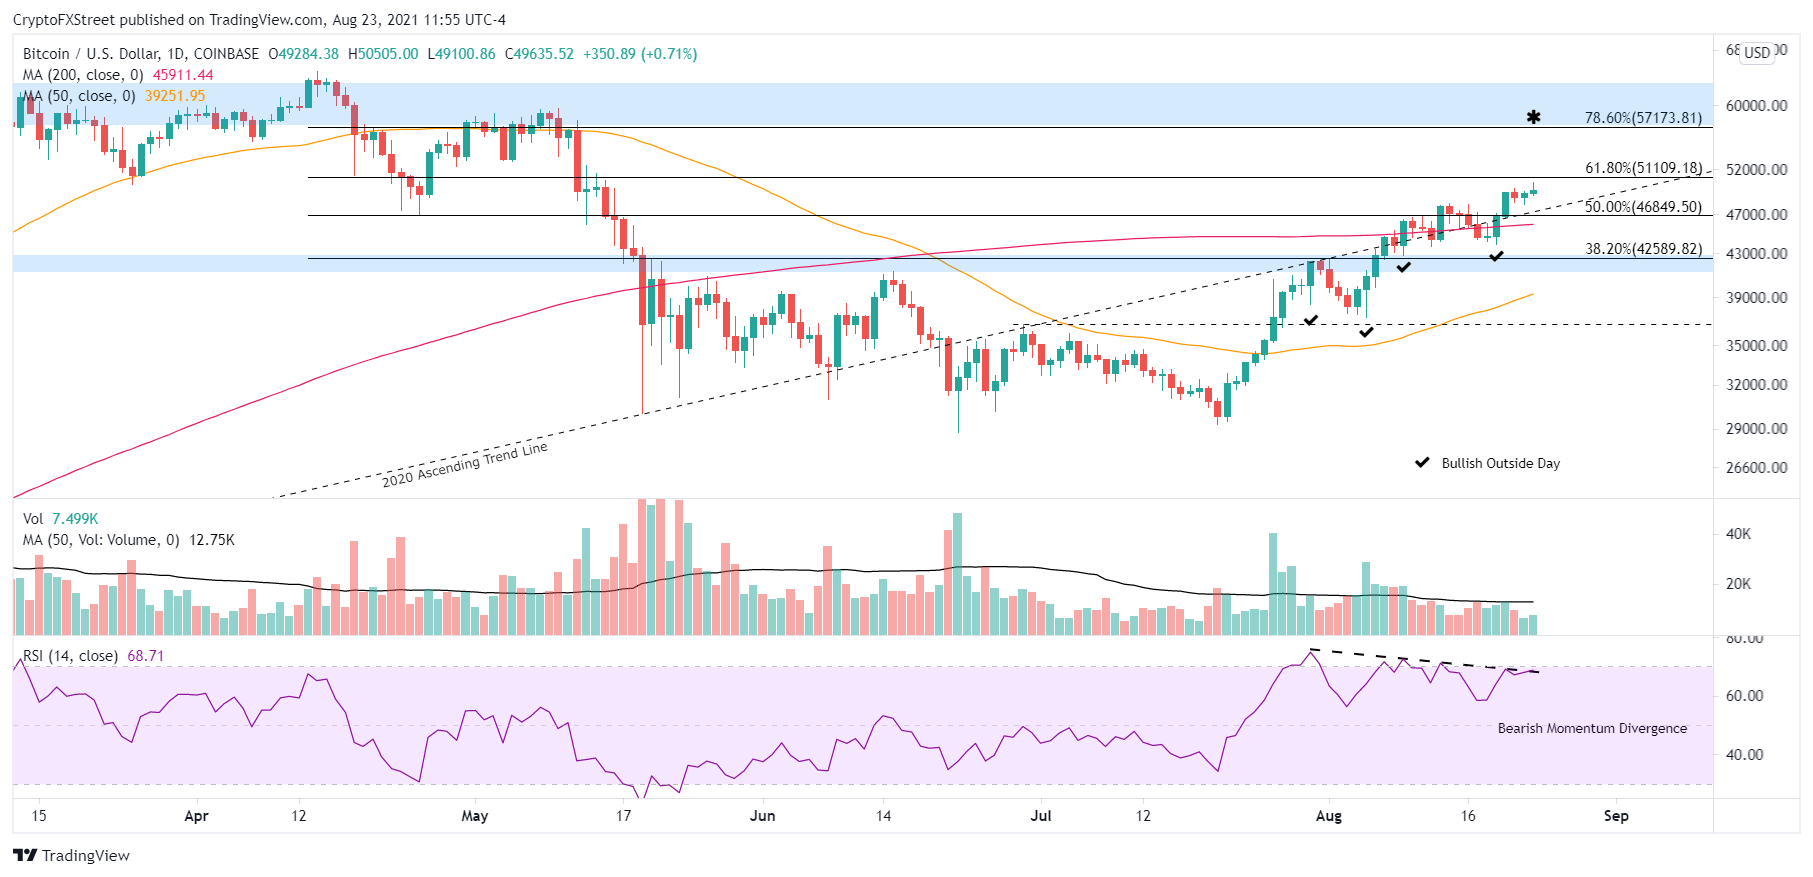
BTC/USD daily chart
Suppose the bearish momentum divergence becomes a headwind for Bitcoin price. In that case, it is well supported by the earlier trifecta of support between $41,500 and $43,000, which includes the January high, the February low, the June high, and the 38.2% retracement level at $42,589. Only a daily close below $41,500 would alter the bullish BTC narrative.
An interesting but favorable development for Bitcoin price is the amount of negative commentary toward BTC. The Santiment Weighted Sentiment for BTC is the most negative since July, despite the rise to $50,000.
Often when the sentiment is bearish while Bitcoin price is rallying, it projects higher prices for the bellwether cryptocurrency.
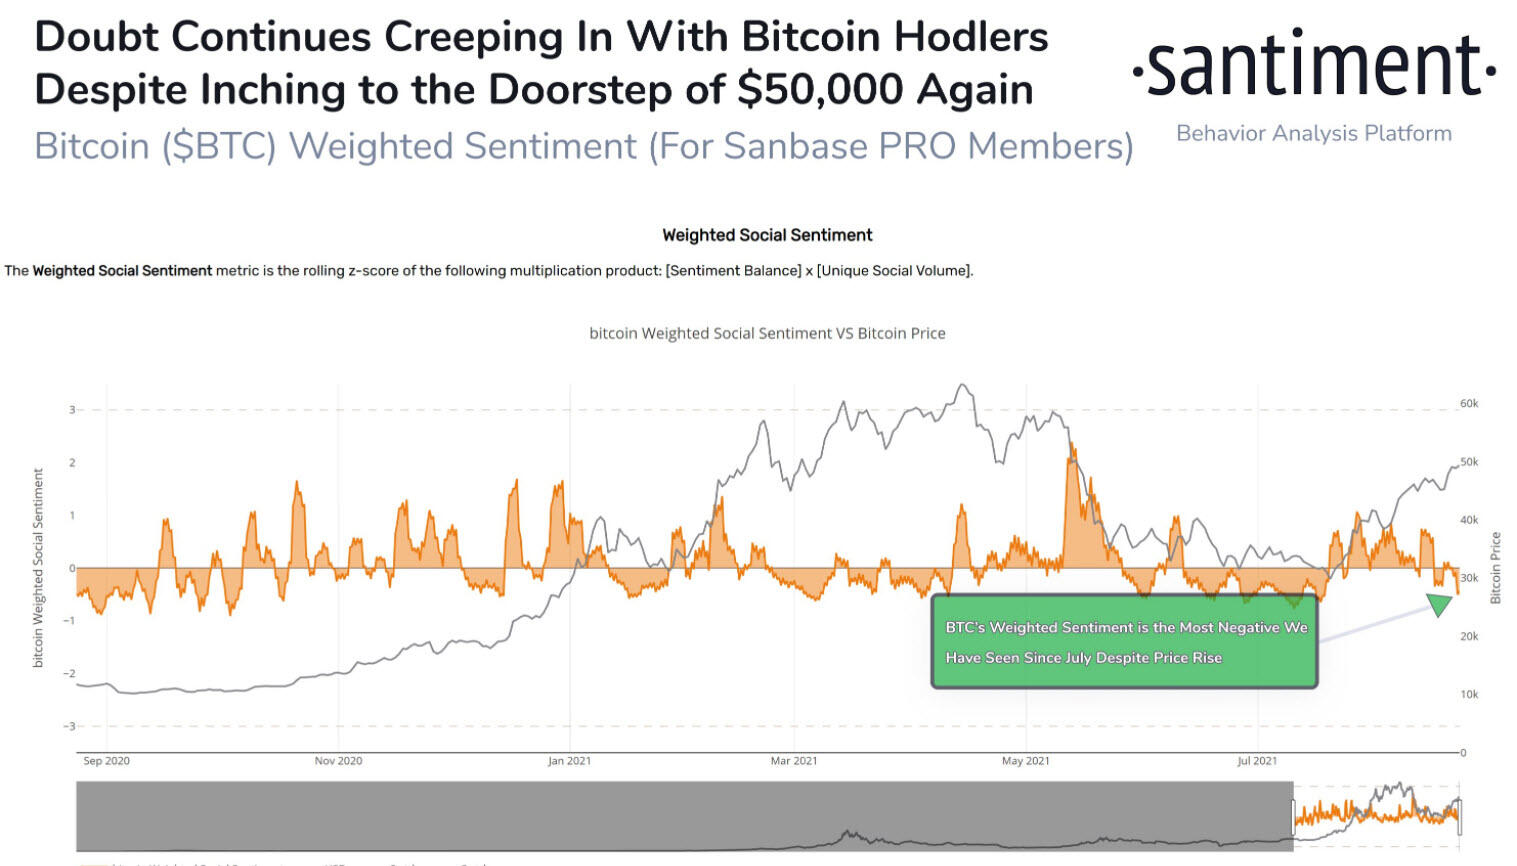
BTC weighted sentiment – Santiment
Here, FXStreet's analysts evaluate where the BTC trend will resolve.


