
- TRON price seems to be forming a massive descending triangle on a weekly time frame.
- As TRX approaches the horizontal support level at $0.058, the chances of a breakdown amplify.
- A weekly candlestick close above the hypotenuse at $0.087 will invalidate the bearish outlook.
TRON price seems to be consolidating after rallying exponentially since March 2020. This massive coiling up at the top seems to have formed a bearish pattern that indicates a correction is due for TRX.
TRON price prepares for a nosedive
TRON price formed three lower highs since its all-time high at $0.180 in April 2021, suggesting that the downtrend has begun. During this time, TRX set up three equal lows at $0.058 and is currently trading close to this level.
Connecting these swing points using trend lines reveals a descending triangle formation. This technical formation forecasts that TRON price is due for a 59% correction to $0.023. The target is obtained by measuring the distance between the first swing high and swing low to the breakout point at $0.058.
A breakout from a descending triangle has a bearish bias in general, but the formation of this pattern after a 1,300% exponential rally adds credence to a crash for TRX. Moreover, the entire crypto market is experiencing a bear market with most of the top 100 coins by market capitalization down more than 60%.
Hence, investors need to watch closely for a weekly candlestick close below $0.058, which will signal that TRON price will crash.
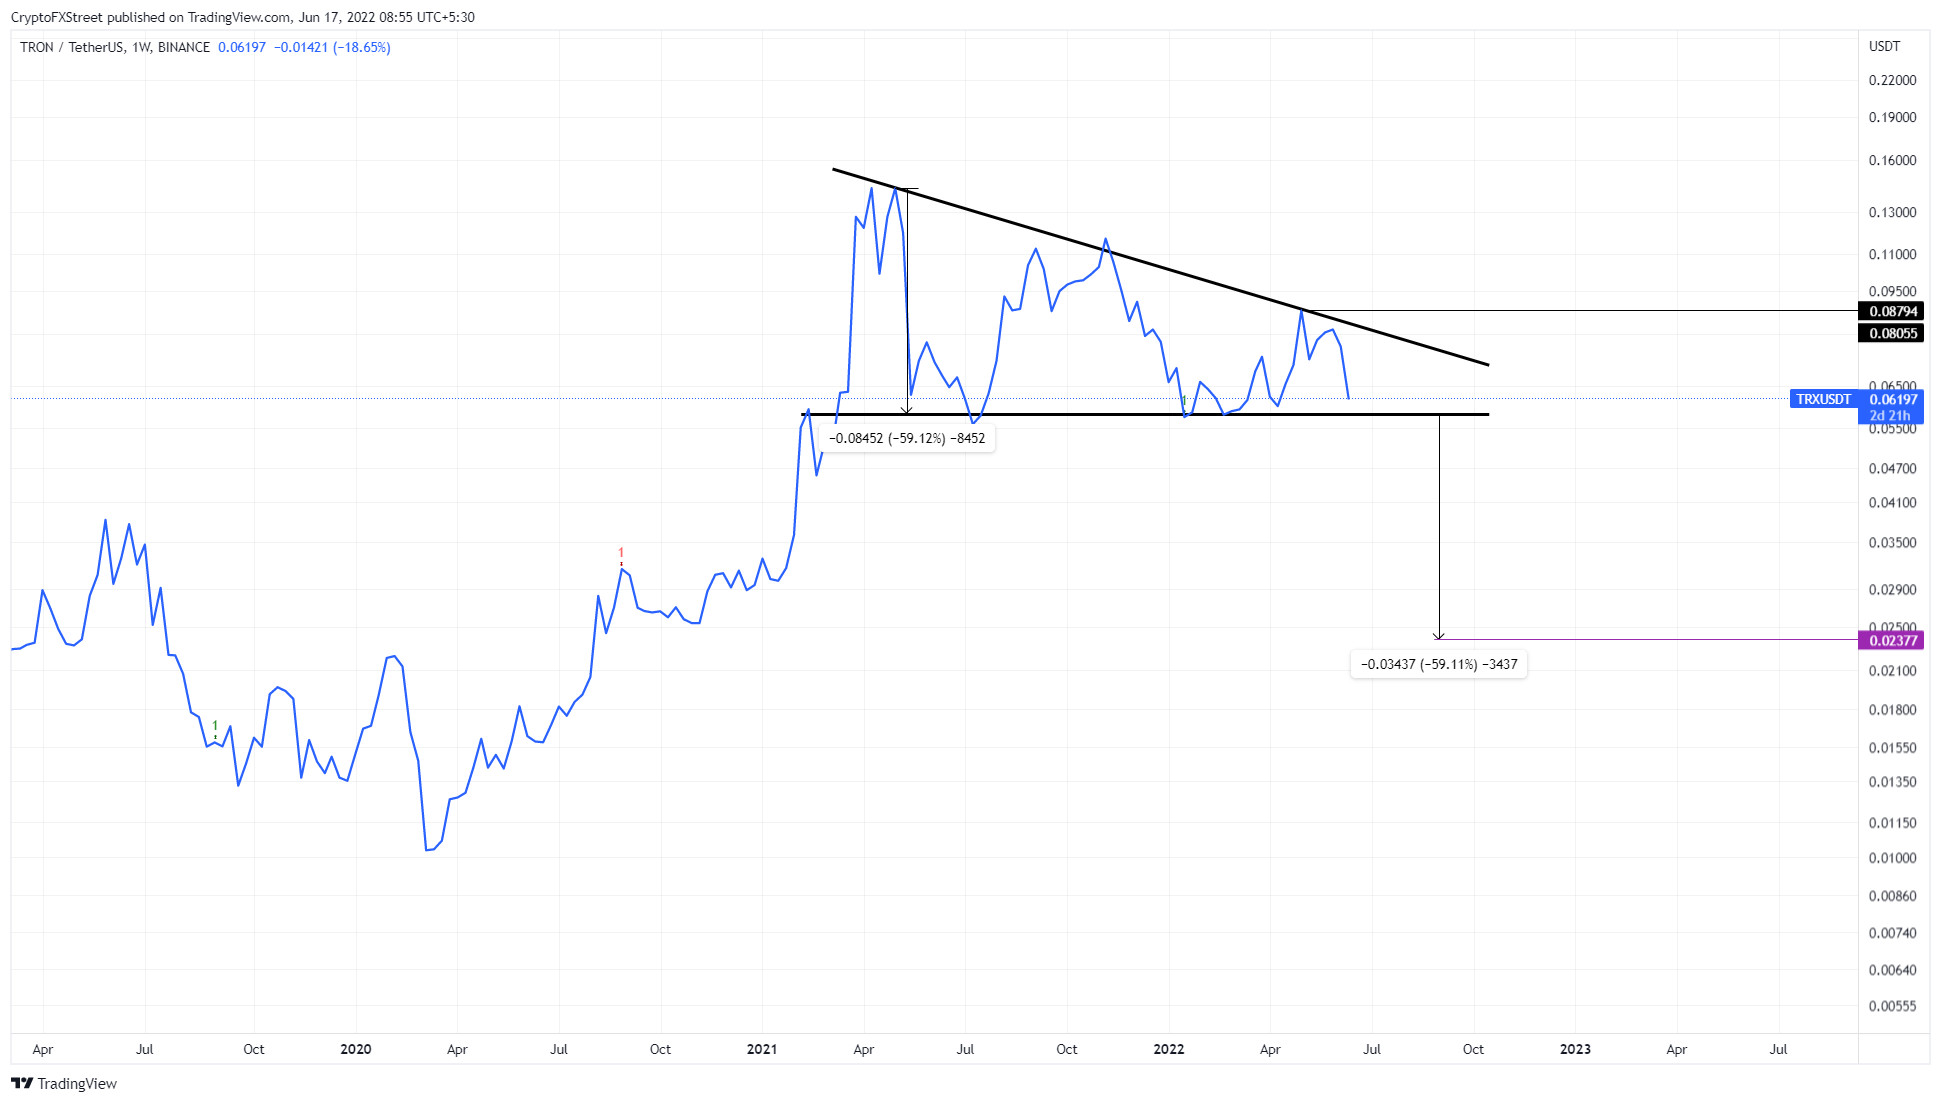
TRX/USDT 1-week chart
While things are looking unmistakably bearish, a sudden turnaround that pushes TRON price to produce a weekly candlestick close above the hypotenuse at $0.087 will invalidate the bearish outlook.
This move will produce a higher high and could attract sidelined buyers that could further add a tailwind and propel TRON price to November 15 swing high at $0.129.


