
- USD/CAD bears are lurking below the counter trendlines on the weekly and daily charts.
- Bears will look for a restest of the weekly trendline support near 1.2520.
USD/CAD has been testing the downside although has recently recovered. However, the weekly chart is seeing the price run into the M-formation's neckline. This could be expected to act as resistance, considering the break of the trendline support.
USD/CAD weekly chart
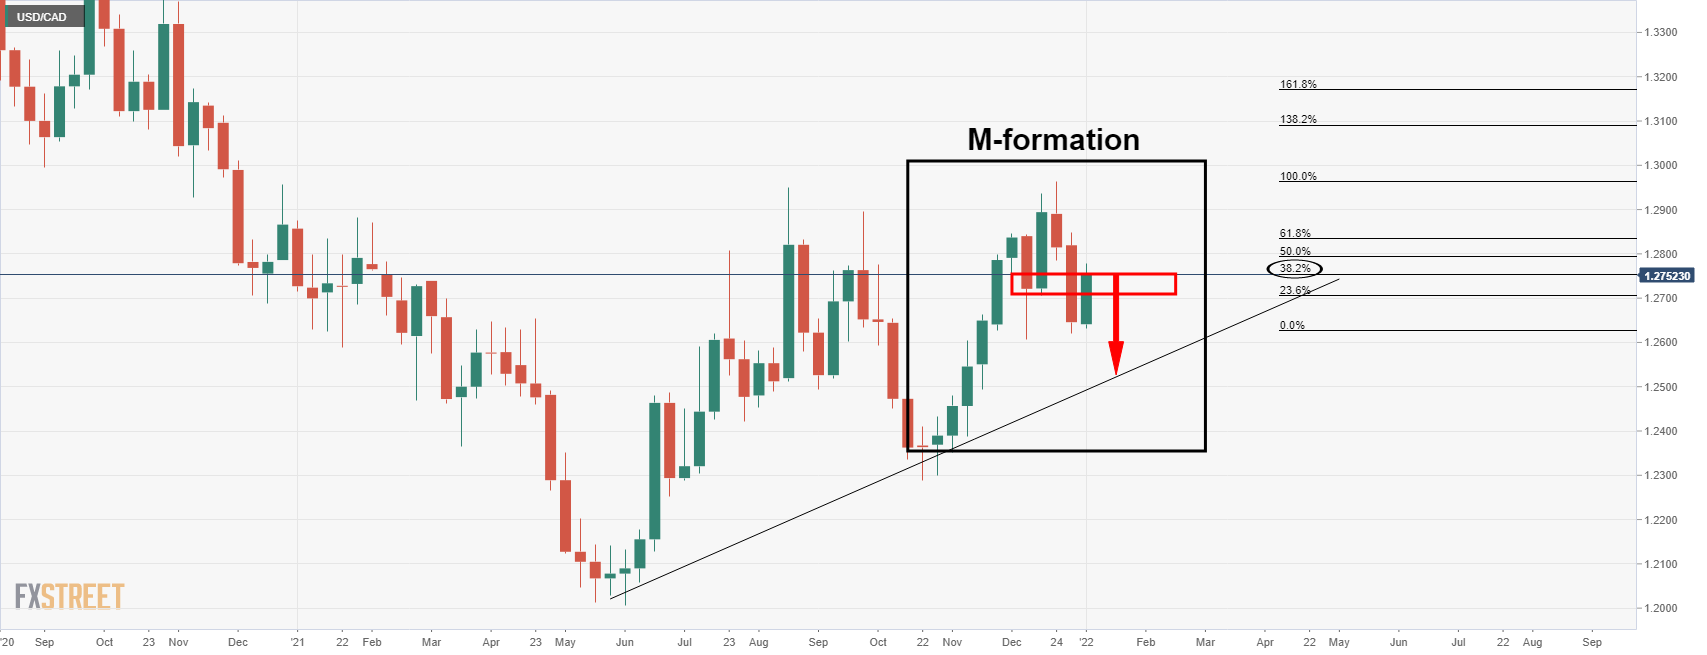
There is also a confluence of Fibonacci levels on both the weekly and daily charts in this area. A restest of the trendline near 1.2520 could be on the cards for the weeks ahead.
USD/CAD daily chart
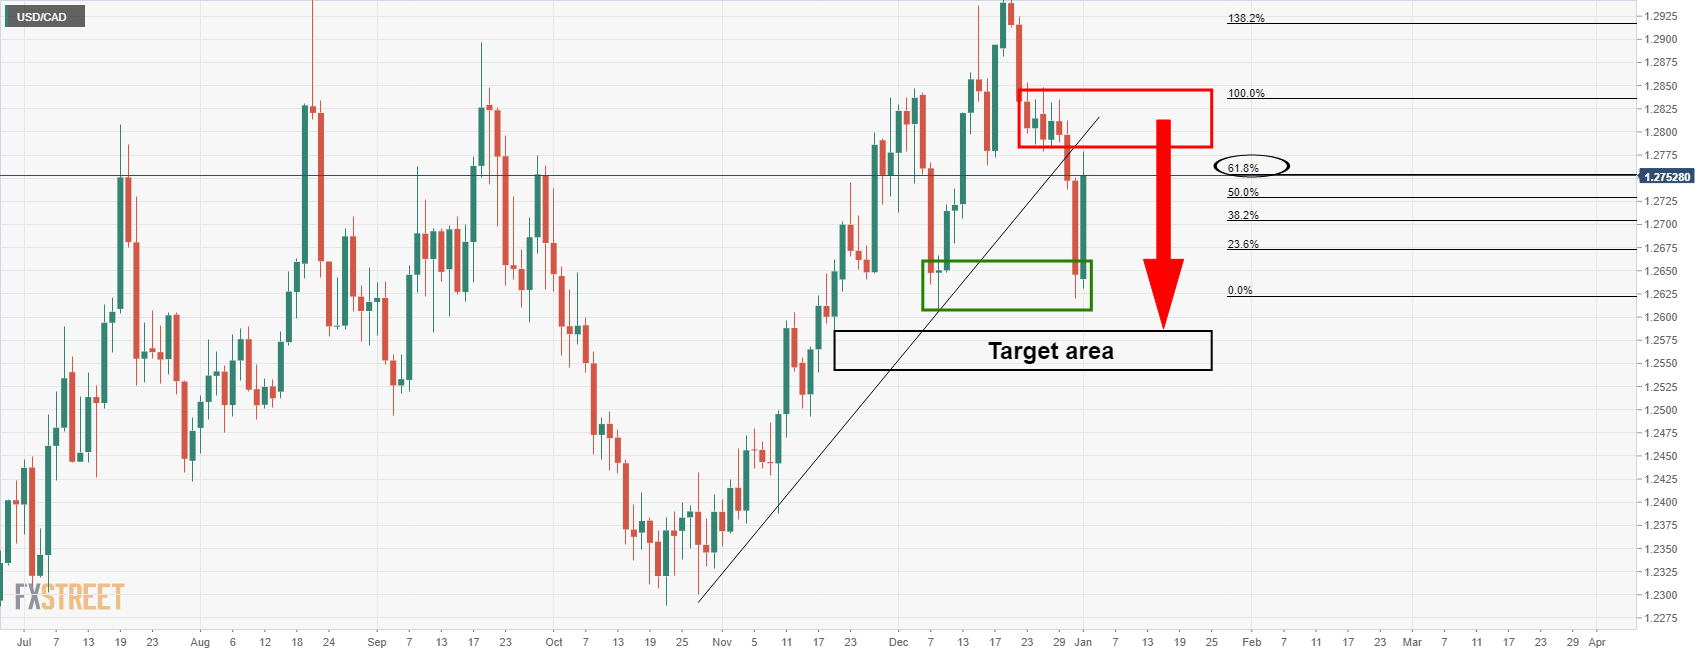
The nearer-term target area is based on an imbalance of price between 1.2585 and 1.2540. The 61.8% Fibonacci is also a compelling area of resistance on the daily chart.
USD/CAD H4 chart
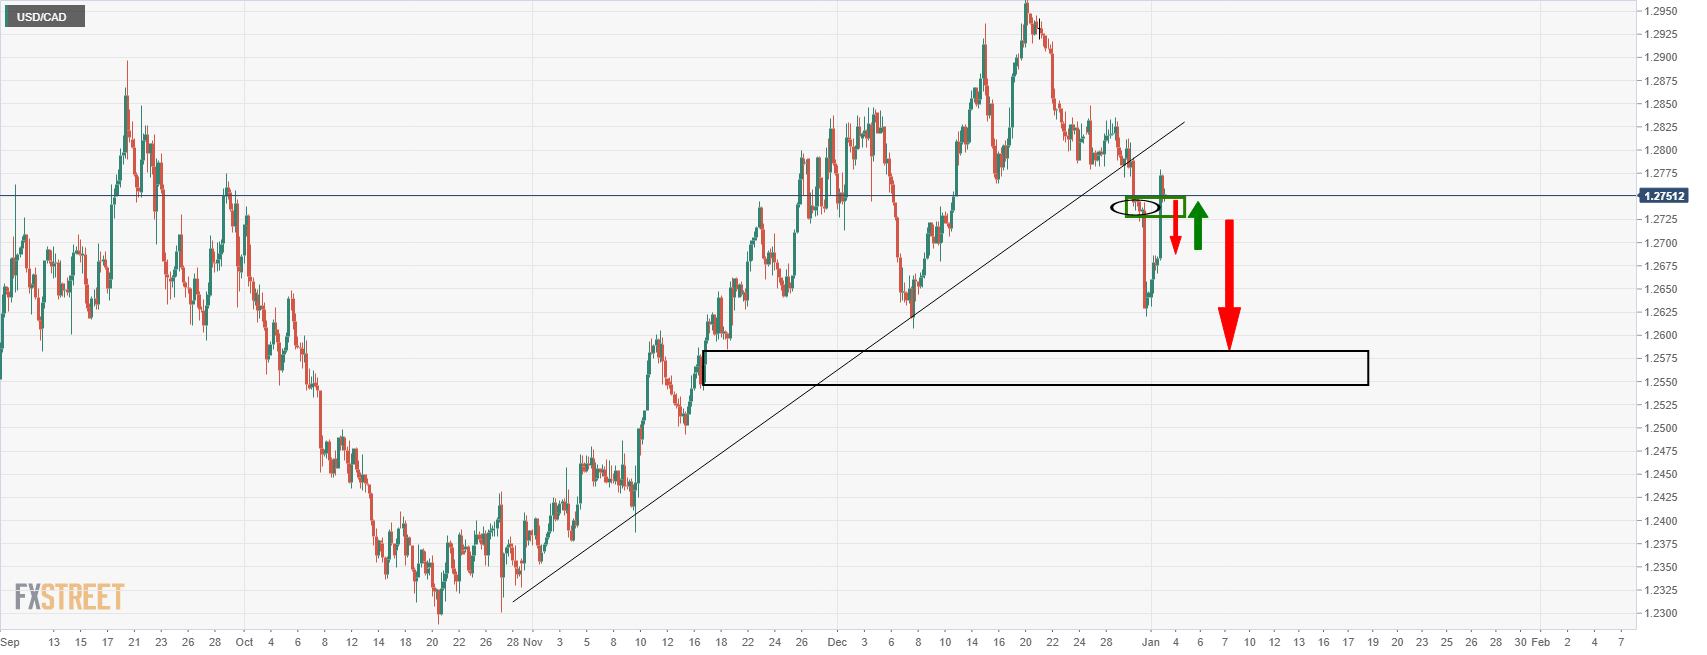
As illustrated, there is a wall of support at this juncture. The bears would be prudent to wait for a bearish confirmation on a break of this 4-hour structure prior to engaging to target towards the 1.2540/85.


