
- USD/CAD portrays a corrective pullback from multi-day bottom.
- A clear downside break of an ascending support line from November 10, 21-DMA favor bears.
- Monthly horizontal resistance adds to the upside barriers, 50-DMA lures sellers.
USD/CAD licks its wounds around 1.2750 during Friday’s Asian session, after dropping the most in a week the previous day.
While refreshing the multi-day low, the Loonie pair broke an ascending support line, now resistance, from November 10, which in turn joins descending Momentum line to favor sellers.
That said, 38.2% Fibonacci retracement of October-December upside, around 1.2705, can restrict the quote’s immediate declines before directing USD/CAD sellers towards the 50-DMA level of 1.2655.
However, a clear downside break of 1.2655 will need validation from seven-week-old horizontal support near 1.2600 before directing the quote further to the south.
Alternatively, recovery moves remain elusive below a confluence of the previous support line and 21-DMA, near 1.2800.
Also acting as a short-term key resistance is the horizontal area comprising multiple tops marked since December 03, close to 1.2845-50.
USD/CAD: Daily chart
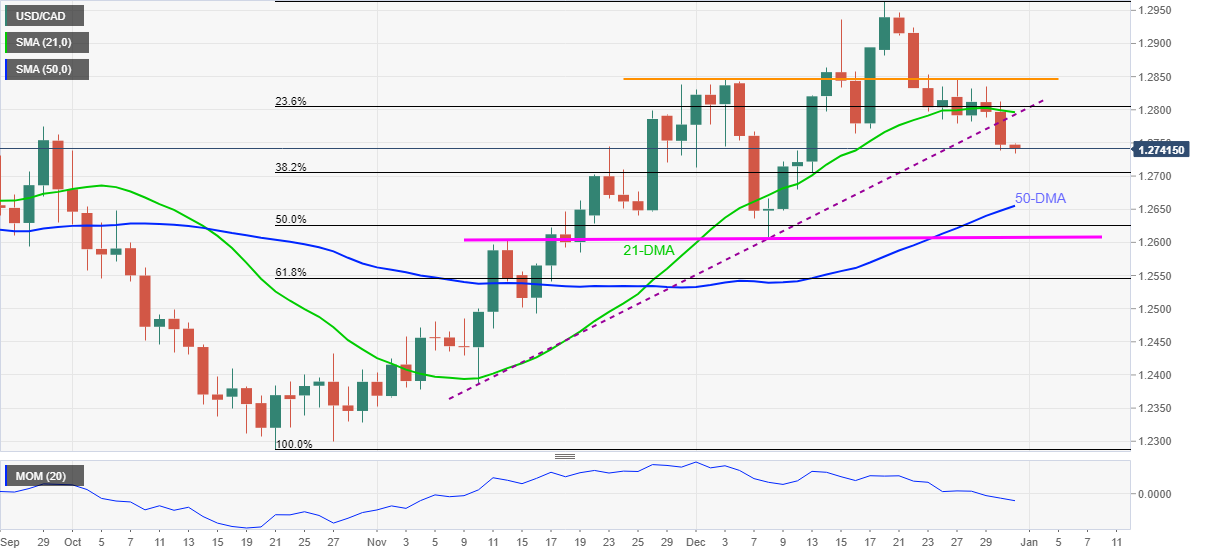
Trend: Further weakness expected


