
- USD/CAD bears throwing in the towel in an area of historic demand.
- The bulls are picking up the pieces in familiar support territory.
USD/CAD is accumulating in what could be the end of a spree of supply that started in the middle of the month on the back of surging oil and commodity prices. The following illustrates the prospects of a significant correction of the bearish impulse that is made up of nine consecutive days of selling:
USD/CAD Daily chart
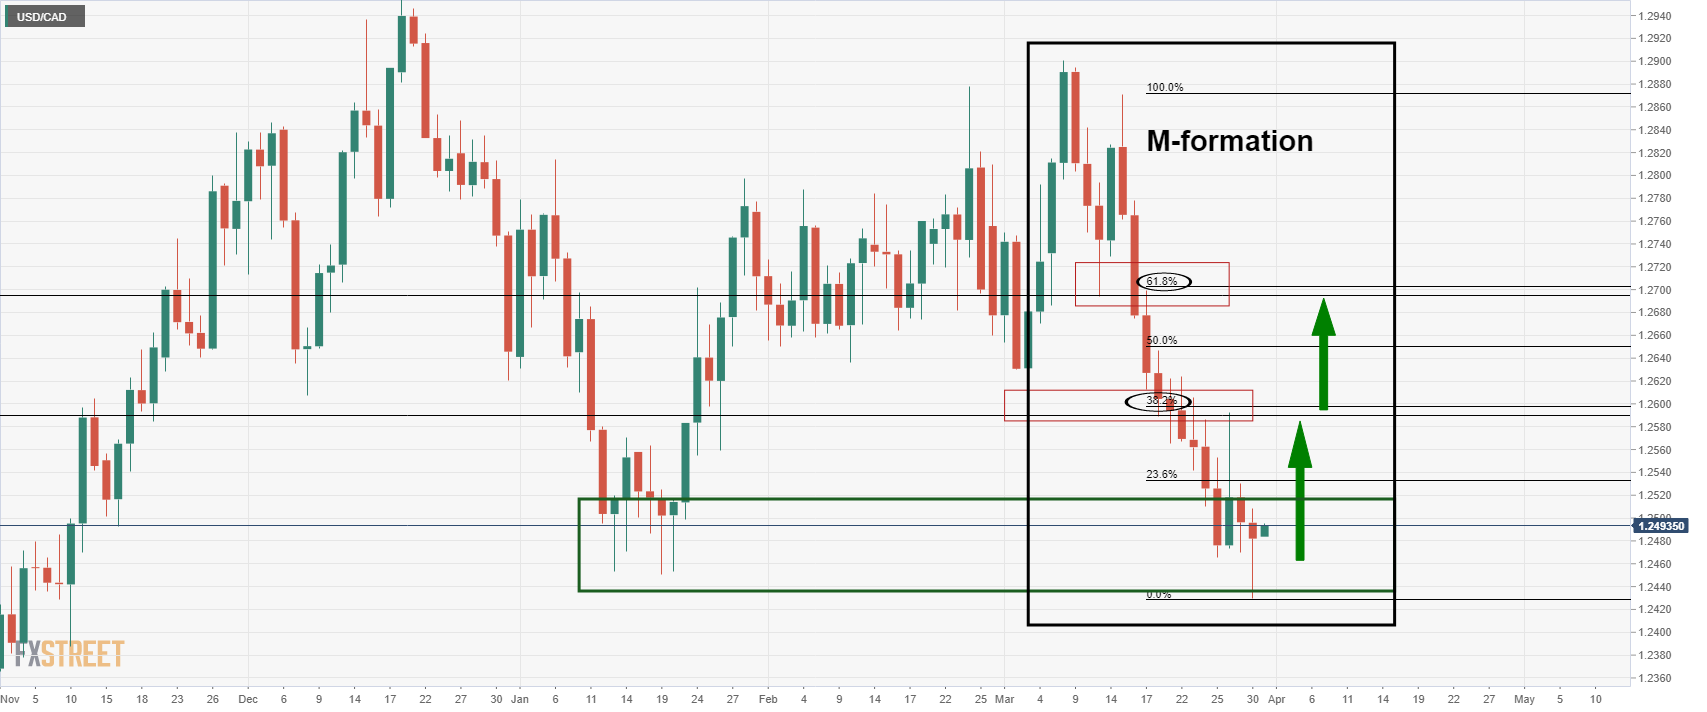
USD/CAD has formed an M-formation on the daily chart, as illustrated above. This is a reversion pattern that would be expected to lure in the bulls all the way to the prior lows or even as far as the neckline of the structure. The first resistance structure is near the 38.2% Fibonacci level while the next structure above is where the neckline meets the 61.8% Fibonacci retracement level.


