
- USD/CAD snaps two-day uptrend, justifies bearish candlestick formation.
- Downbeat Momentum line, short-term bearish chart pattern also keeps sellers hopeful.
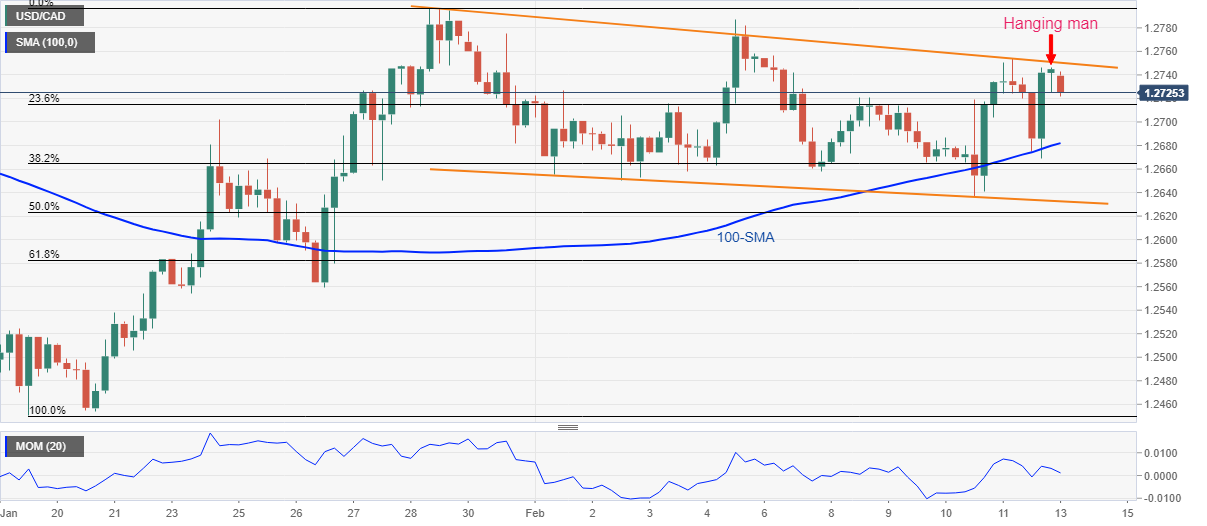
- 100-SMA, channel’s support lure bears, bulls need validation from January’s top.
USD/CAD consolidates recent gains inside a bearish channel formation, stepping back from the resistance line to 1.2730 during Monday’s Asian session.
In doing so, the Loonie pair justifies the late Friday’s ‘Hanging man’ candlestick, as well as the Momentum line’s retreat, to register daily losses for the first time in three.
With this, USD/CAD prices are likely to extend the latest pullback towards the 100-SMA level near 1.2680.
However, the lower line of the stated two-week-old descending trend channel, near 1.2630, will restrict the pair’s further weakness, if not then the late January’s swing low around 1.2560 should return to the charts.
On the flip side, the channel’s resistance line near 1.2750 and late January’s peak around 1.2800 will restrict short-term upside moves of the USD/CAD pair.
Following that, the last monthly top near 1.2815 will be the key as a break of which will direct USD/CAD bulls towards the 1.3000 psychological magnet.
USD/CAD: Four-hour chart
Trend: Pullback expected


