
- USD/CAD rises to the highest levels in six days above 1.2800.
- The US dollar’s strength remains unabated amid hawkish Fed outlook.
- The pair charted a falling wedge on the daily sticks, more room to rise.
USD/CAD is building onto Wednesday’s rebound, accelerating the advances above 1.2800 ahead of the US economic releases, including the key ISM Services PMI.
The main catalysts behind the pair’s bullish momentum are the extended rebound in the US dollar and weaker WTI prices.
The greenback capitalizes on firmer Treasury yields after the FOMC minutes suggested earlier and faster Fed rate hikes and also hinted at kickstarting balance sheet reduction this year.
Meanwhile. WTI keeps its corrective downside intact below $78 amid broad risk aversion, triggered by surging coronavirus cases globally and concerns over a potential Fed’s aggressive tightening.
Looking at the daily chart, USD/CAD has confirmed a falling wedge breakout on Wednesday after closing the day above the falling trendline resistance at 1.2743. The extension of the bullish breakout saw the pair recapturing the critical 21-Daily Moving Average (DMA) at 1.2798.
Buyers eye a daily closing above the latter to take on the recent range highs at around 1.2850. Further up, all eyes will remain on the 1.2900 level. The 14-day Relative Strength Index (RSI) looks north just above the midline, backing the bullish view.
USD/CAD: Daily chart
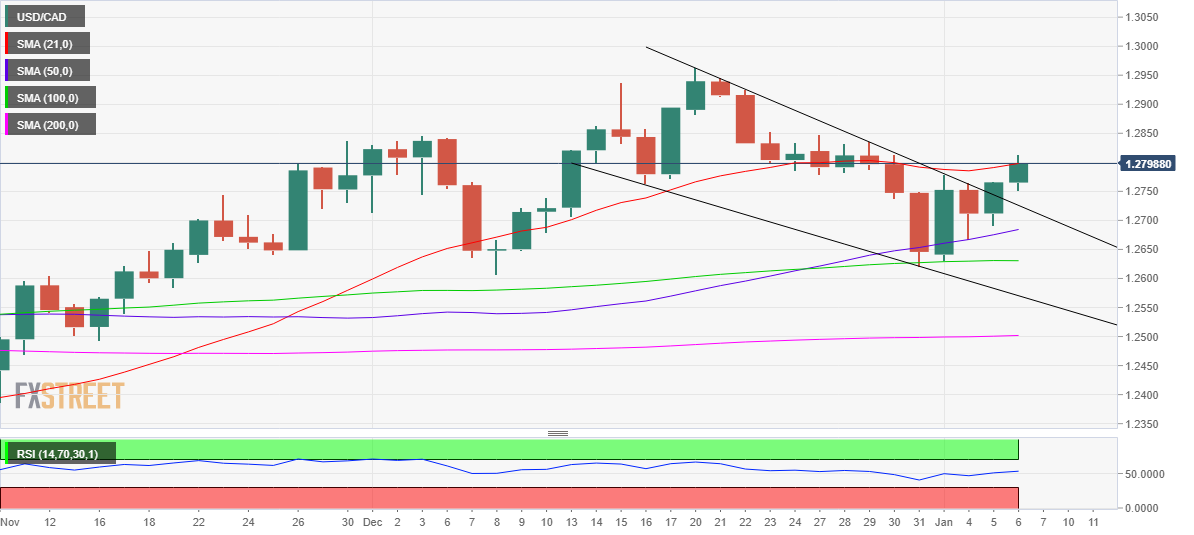
On the flip side, the spot could retrace to test the wedge resistance-turned-support at 1.2723, below which a sharp drop towards the bullish 50-DMA at 1.2684 cannot be ruled out.
If the downside momentum accelerates, sellers could aim for the horizontal 100-DMA at 1.2630.


