- USD/JPY bears stepping in at critical hourly 61.8% Fibo.
- Prospects of downside continuation on the cards, but weekly support should be noted.
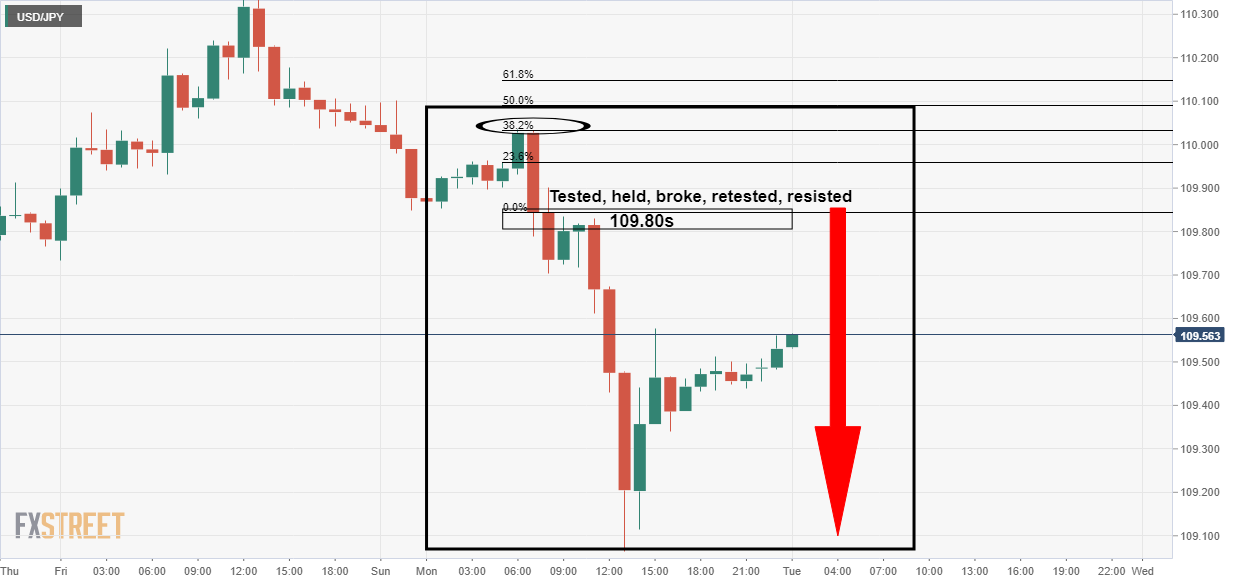
As per the prior analysis, USD/JPY bears seeking a test of 109.80s, the pair fell to the target and way beyond, but the price action was what counts.
The current environment is stacking up to replicate the type of scenario as yesterday's outcome and a downside continuation could be on the cards from both an hourly and daily perspective.
However, there are dangers of an extended correction, so bears will need to tread carefully at this juncture and not find themselves caught in a bear trap.
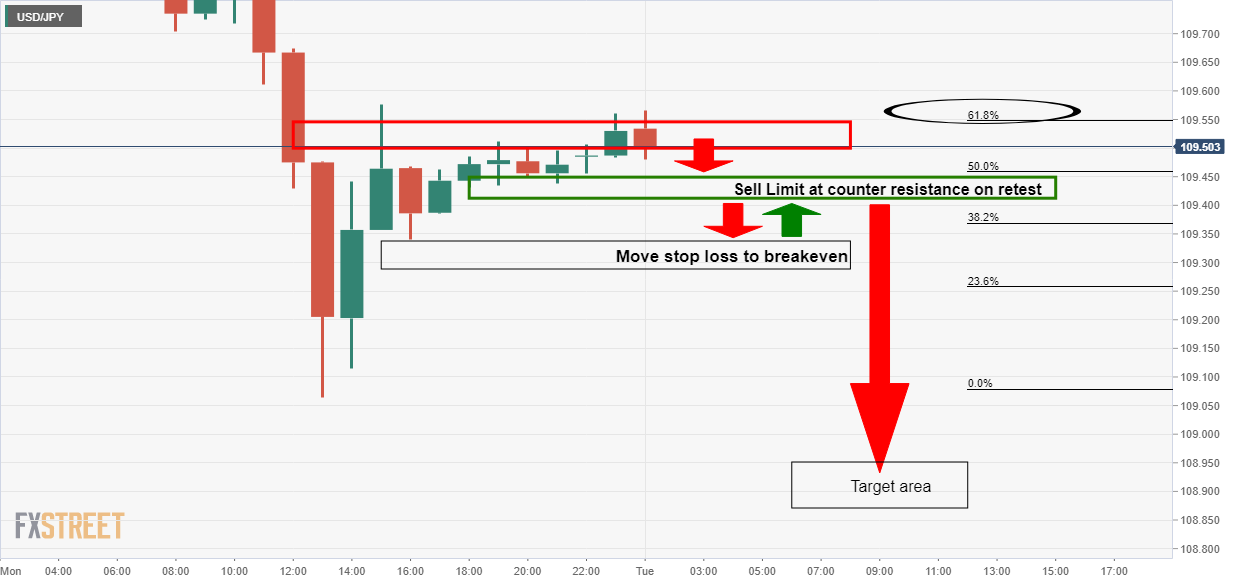
Prior analysis, hourly chart
A correction, in the meanwhile, could be on the cards following a series of uninterrupted hourly bearish candles.
The resistance and confluence with the 23.6% and 38.2% Fibonaccis are compelling for a restest prior to the next downside impulse to test the bull's commitments at the 109.80 level.
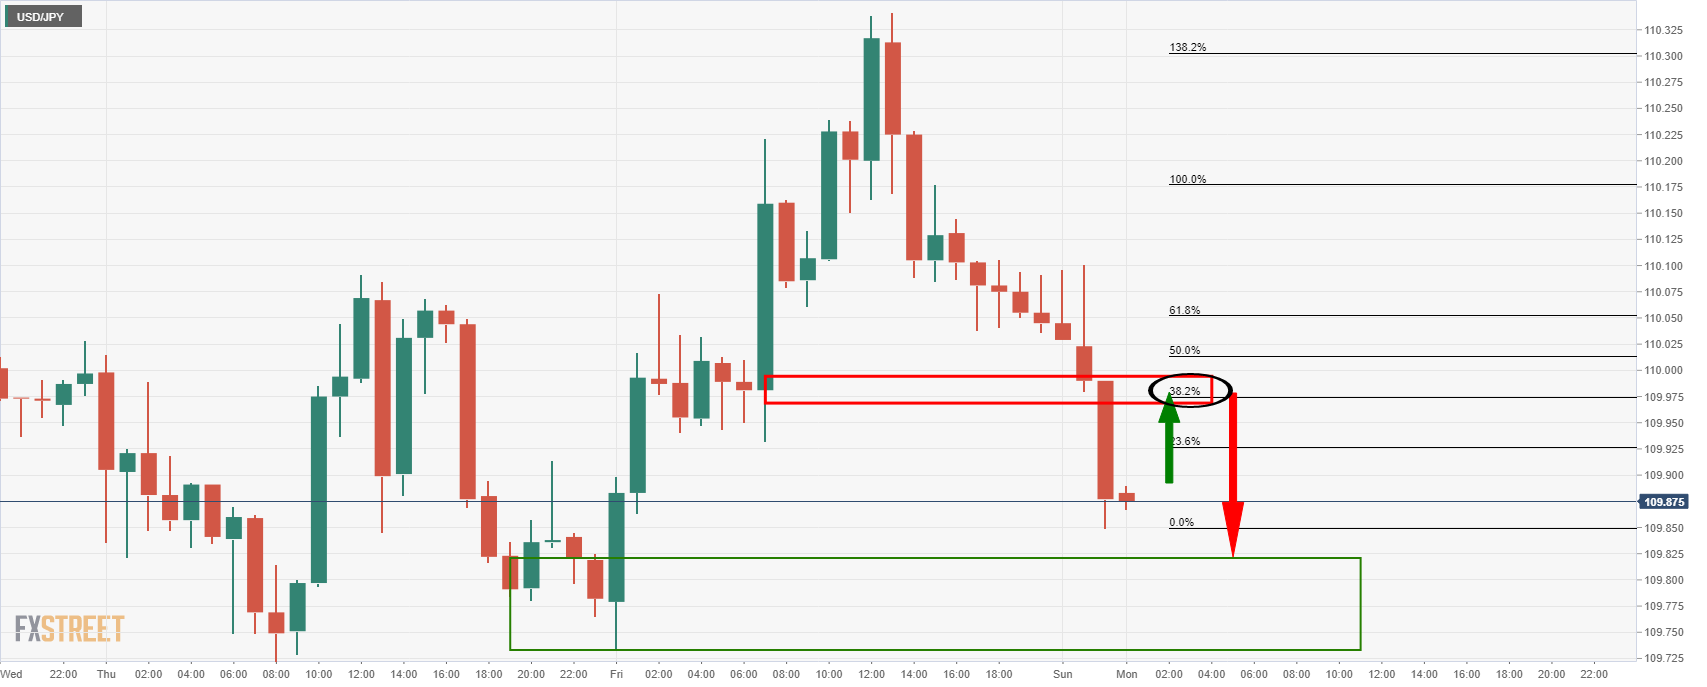
Live market and outcome
As forecasted, the price indeed corrected to 38.2%, fell to the target, held, broke, retested it as a strong level of new resistance and then melted from that point onwards to the lows.
The next challenge is determining the next path of least resistance and according to the price action and market structure, it is to the downside.
However the daily M-formation needs to be considered as a bullish meanwhile market structure, so looking for immediate shorts may not be wise, at least until the structure has been completed.
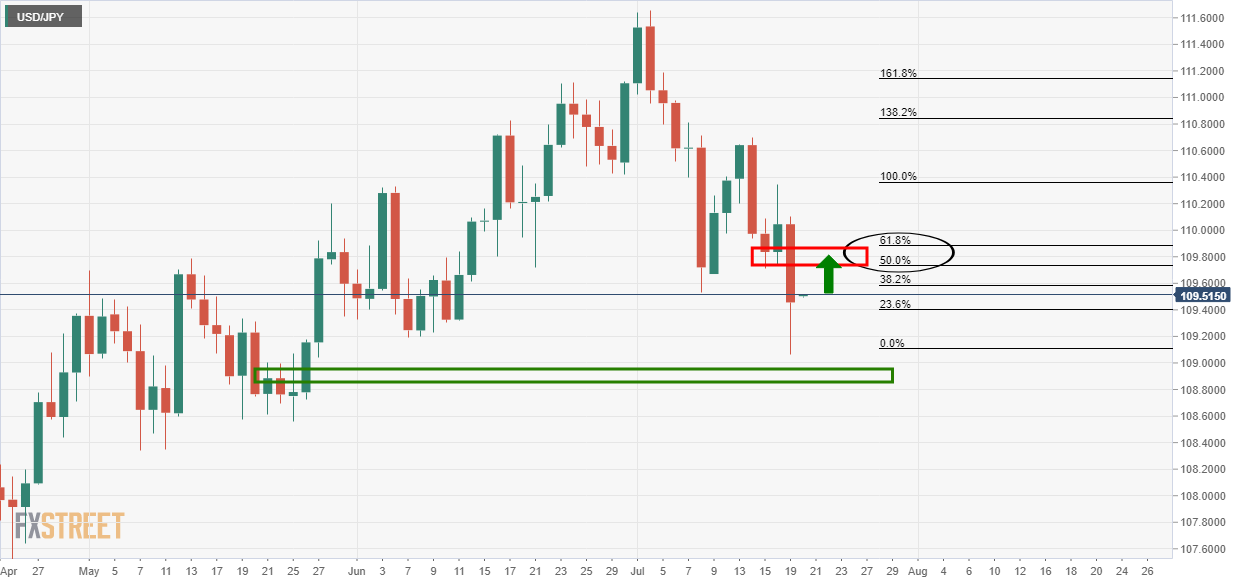
Hourly chart
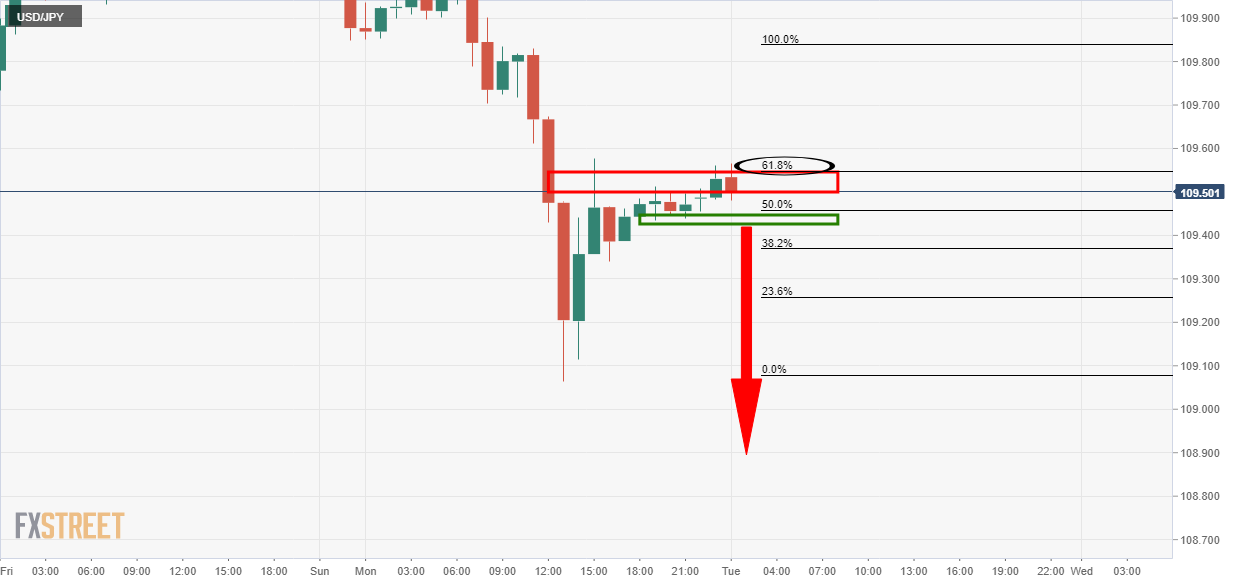
The price has reached a 61.8% Fibonacci retracement and would be expected to melt to the downside form here in a continuation of the bearish and dominant trend.
The initial target to the downside would be a 108.90 level.
Meanwhile, the daily chart looks as follows:
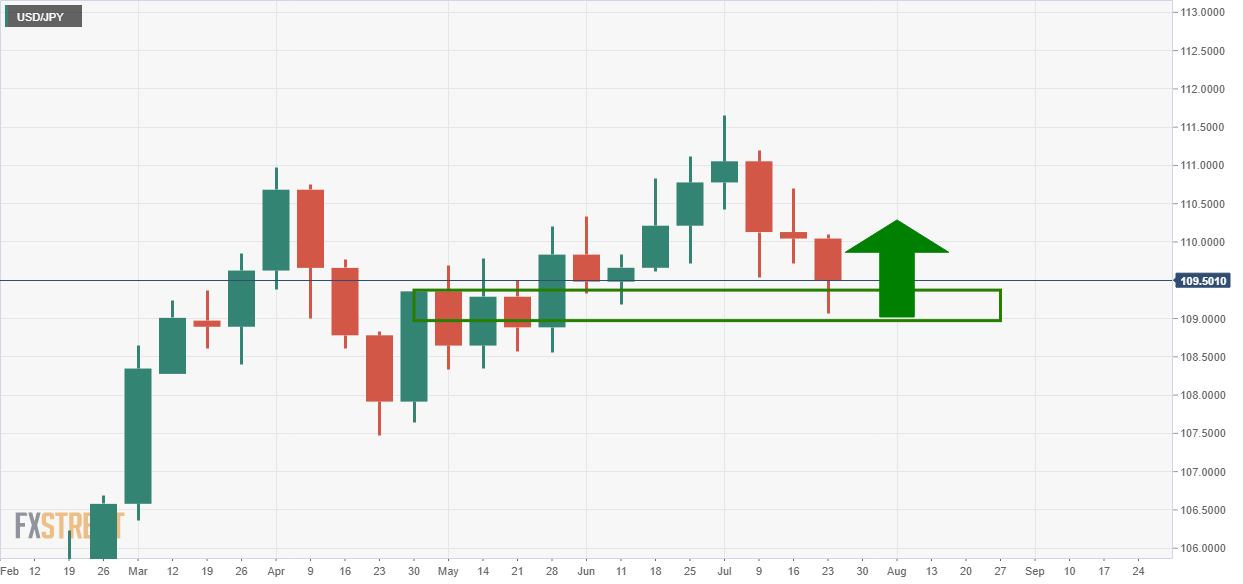
Daily chart

The price has made 38.2% Fibonacci retracement in the hoghs of 109.57 so far.
Therefore, bears can be looking for a downside extension.
With that being said, the correction has been very sharp and with little in the way of a declaration on the way to the 38.2% Fibo.
This rings alarm bells.
not only that, the M-formation is a bullish formation that would be expected to attract bids into the neckline of the formation and prior daily lows in the 109.70/80 area.
Therefore, a deeper correction to the 50% mean reversion or even the 61.8% Fibonaccis could be on the cards for the meanwhile, nullifying the hourly bearish prospects:
Moreover, selling at weekly support is not the most favourable prospect:
However, that is not to say that we will not see a potentially last attempt from the bears to test deeper onto weekly and daily support.
However, in approaching the hourly chart, bears should look for a break of the current support and set up at reduced risk, seeking to breakeven at the earliest opportunity: