- USD/JPY is set to finish the week with gains of 0.25%.
- From a daily chart perspective, the USD/JPY is trading sideways as Japanese intervention in the FX markets looms.
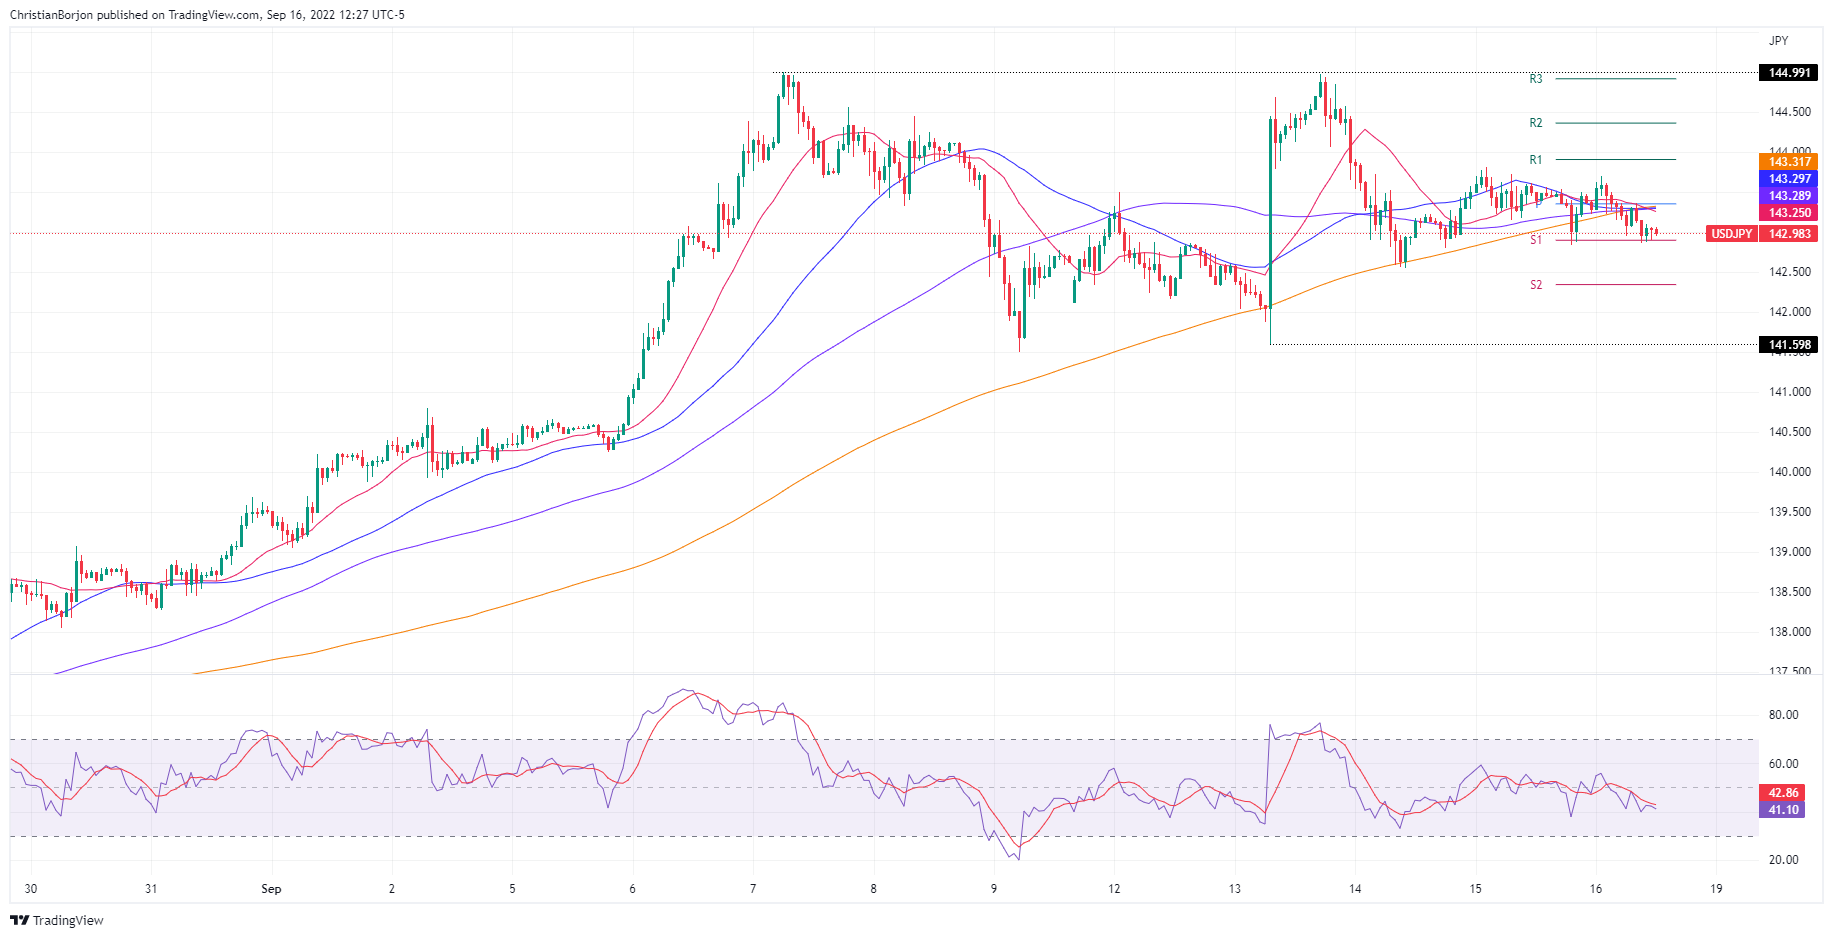
- Short term, the USD/JPY is neutral-downward biased, but a break below 143.00 could pave the way toward 141.59.
The USD/JPY slumps for the second day in the week after falling short of testing the YTD high at 144.99, but fears of Japanese intervention in the FX markets to bolster the yen kept USD buyers at bay, while the major dipped towards the 143.00 handle. The USD/JPY is trading at 142.98 after hitting a daily high at 143.69, down by 0.30%.
USD/JPY Price Analysis: Technical outlook
The USD/JPY daily chart portrays the pair consolidating in the 140.00-144.99 area for the last couple of weeks. USD/JPY price action is overextended to the upside, while the Relative Strength Index, exited from overbought conditions, crossed below its 7-day RSI’s SMA, meaning sellers begin to gather momentum. However, if USD/JPY sellers want to regain control, they need a decisive break below the 20-day EMA at 140.64.
In the near term, the USD/JPY hourly chart portrays the pair as neutral-to-downward biased. Worth noting that the major, once it fell under the 144.00 figure on September 14, stayed below the 143.50 area, trading sideways in the 143.00/50 range. Oscillators are pointing downwards in bearish territory, which suggests selling pressure is mounting in the pair.
If the USD/JPY tumbles below 143.00, the next support would be the S2 daily pivot at 142.33. Once cleared, the next demand zone would be the 142.00 psychological level, ahead of the weekly low hit on September 13 at 141.59.