- USD/JPY bulls are taking on the monthly supply zone, and so far failing.
- The daily chart is teeing up for another bullish advance from support.
The uptrend in USD/JPY is well defined on the longer-term charts but the price has run into a supply territory and it will take another surge in the greenback to on a broad-based perspective to get over the line.
Currently, the DXY is meeting a critical support daily area as follows:
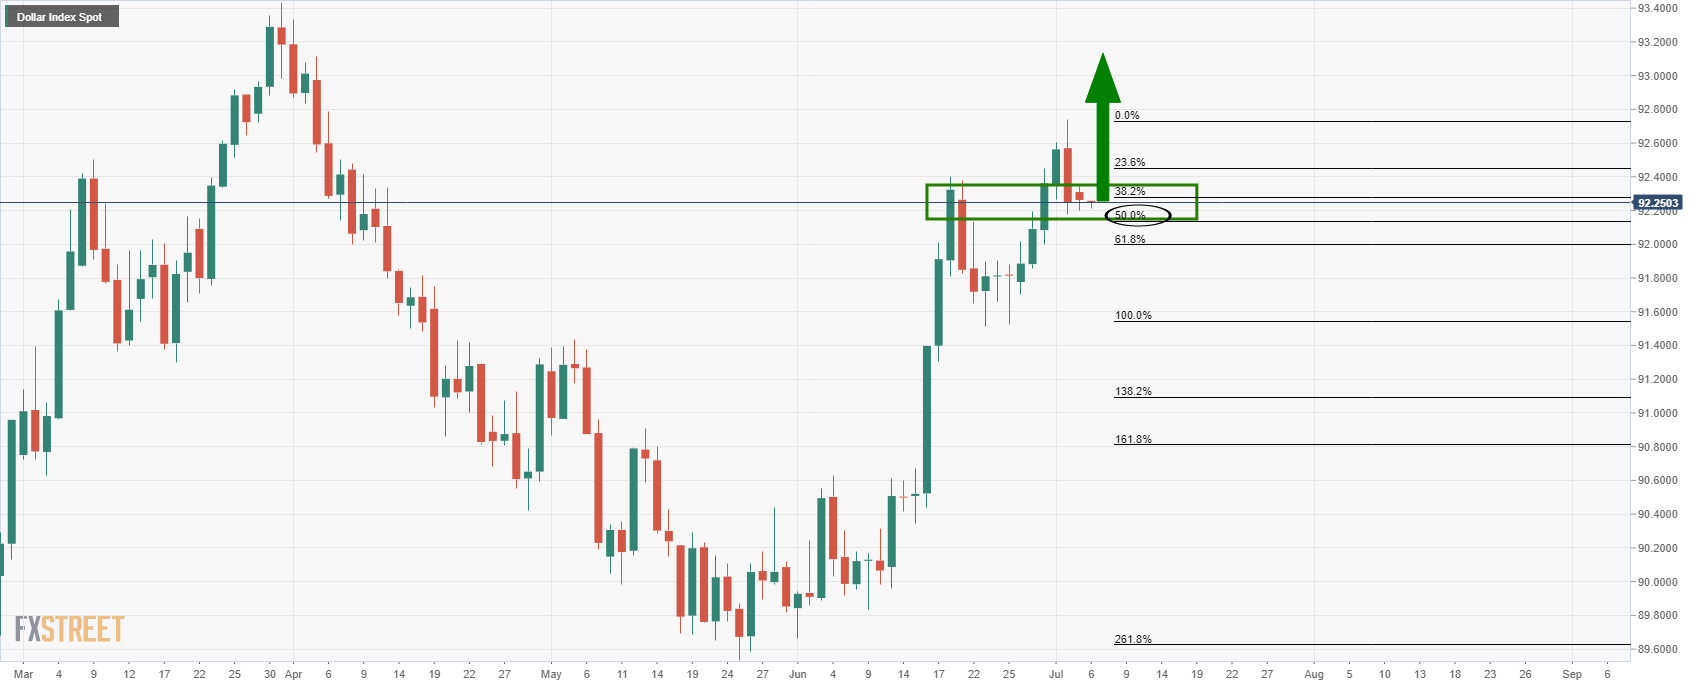
If this support structure holds, there will be a case for the upside in USD/JPY.
However, buying at resistance should not really be a part of a traders playbook.
The following illustrates the market structure of the yen from a top-down basis and concludes that a long position should be taken with measures to limit downside exposure and risk of a losing trade.
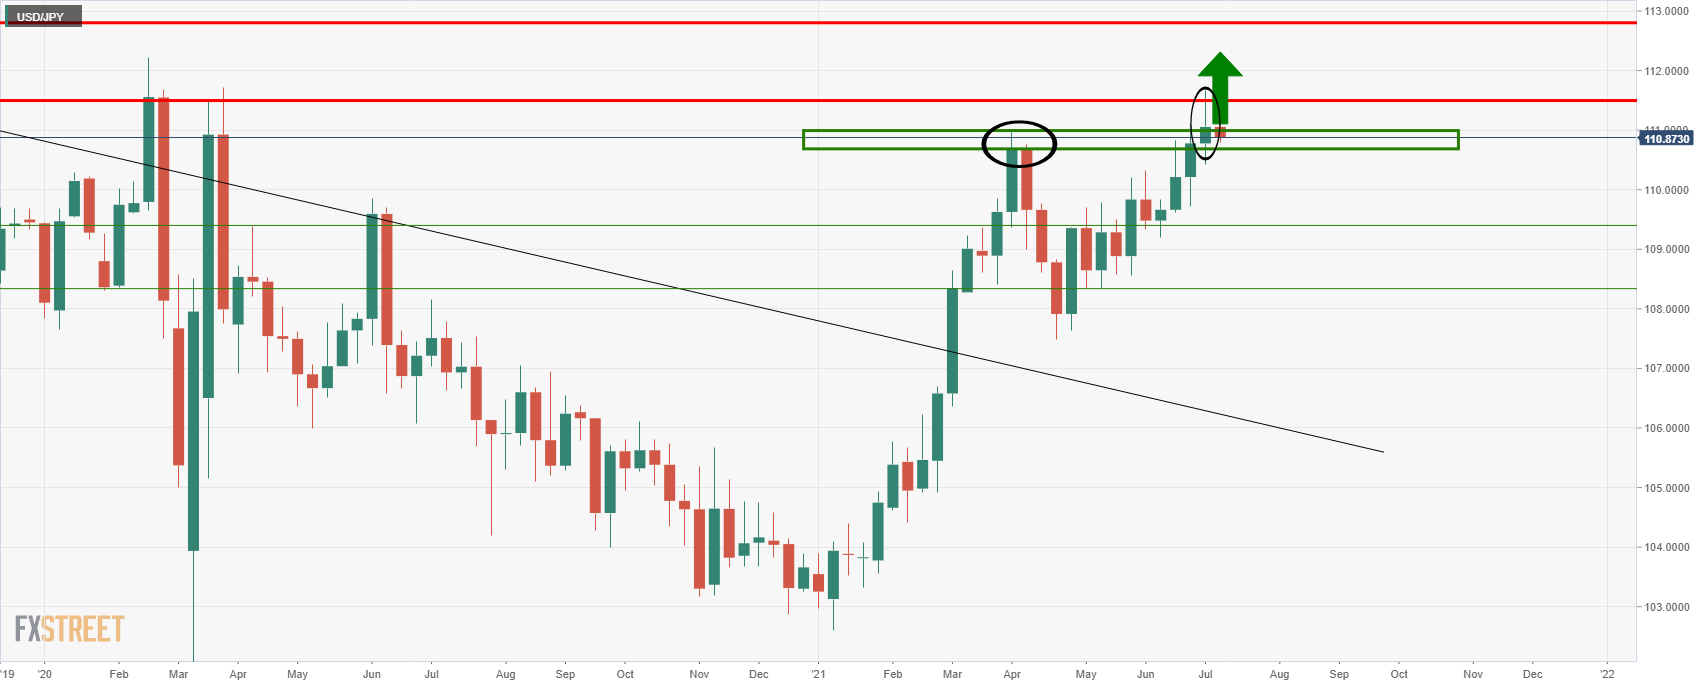
USD/JPY monthly chart
As illustrated, the price is in a well-defined uptrend but it is now meeting what would be expected to be strong monthly resistance.
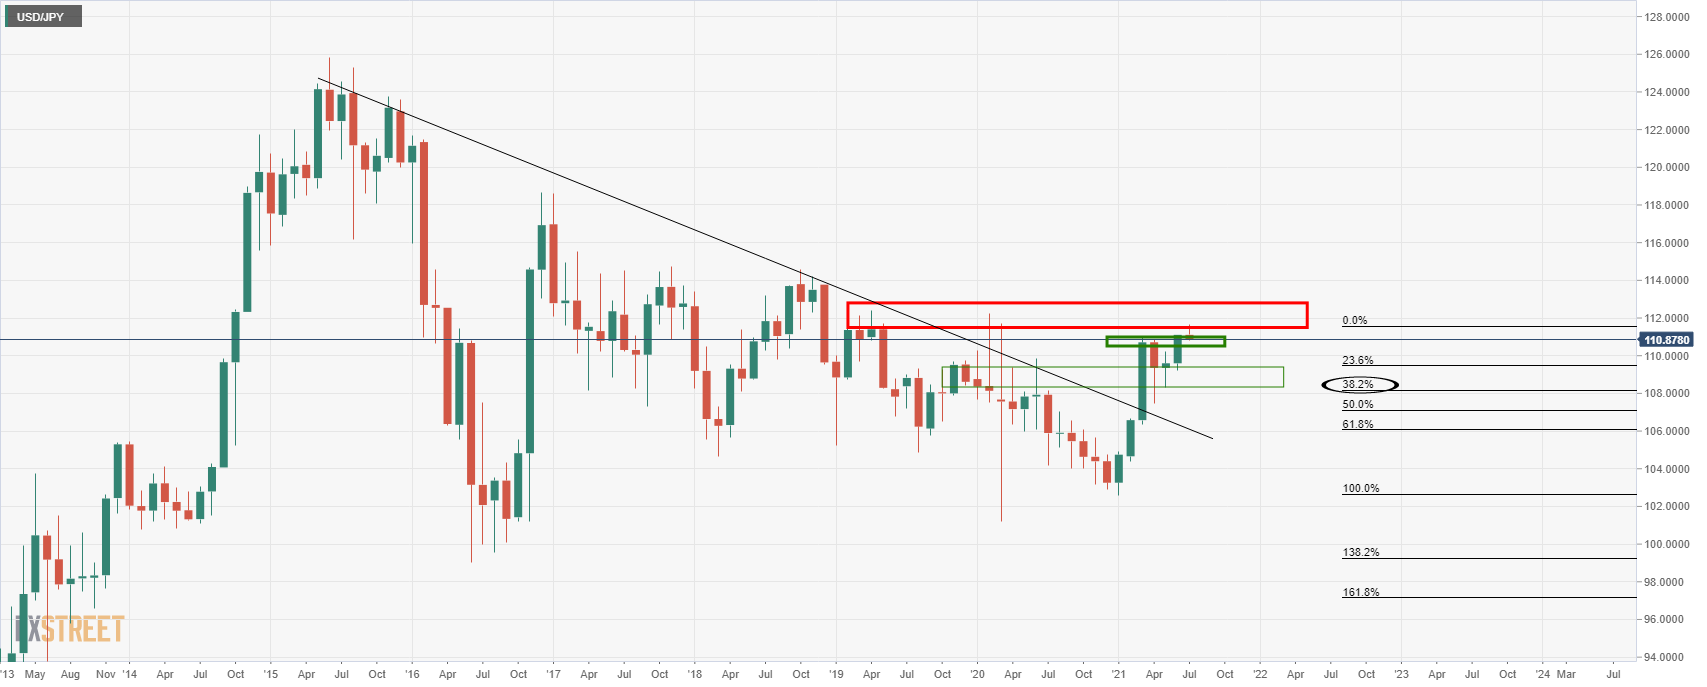
This means that the price could easily equate to a downside correction, despite having already retraced to the 38.2% Fibonacci.
With that being said, the June candle did close higher than the prior monthly highs which could be argued to now serve as near-term support at 110.85:
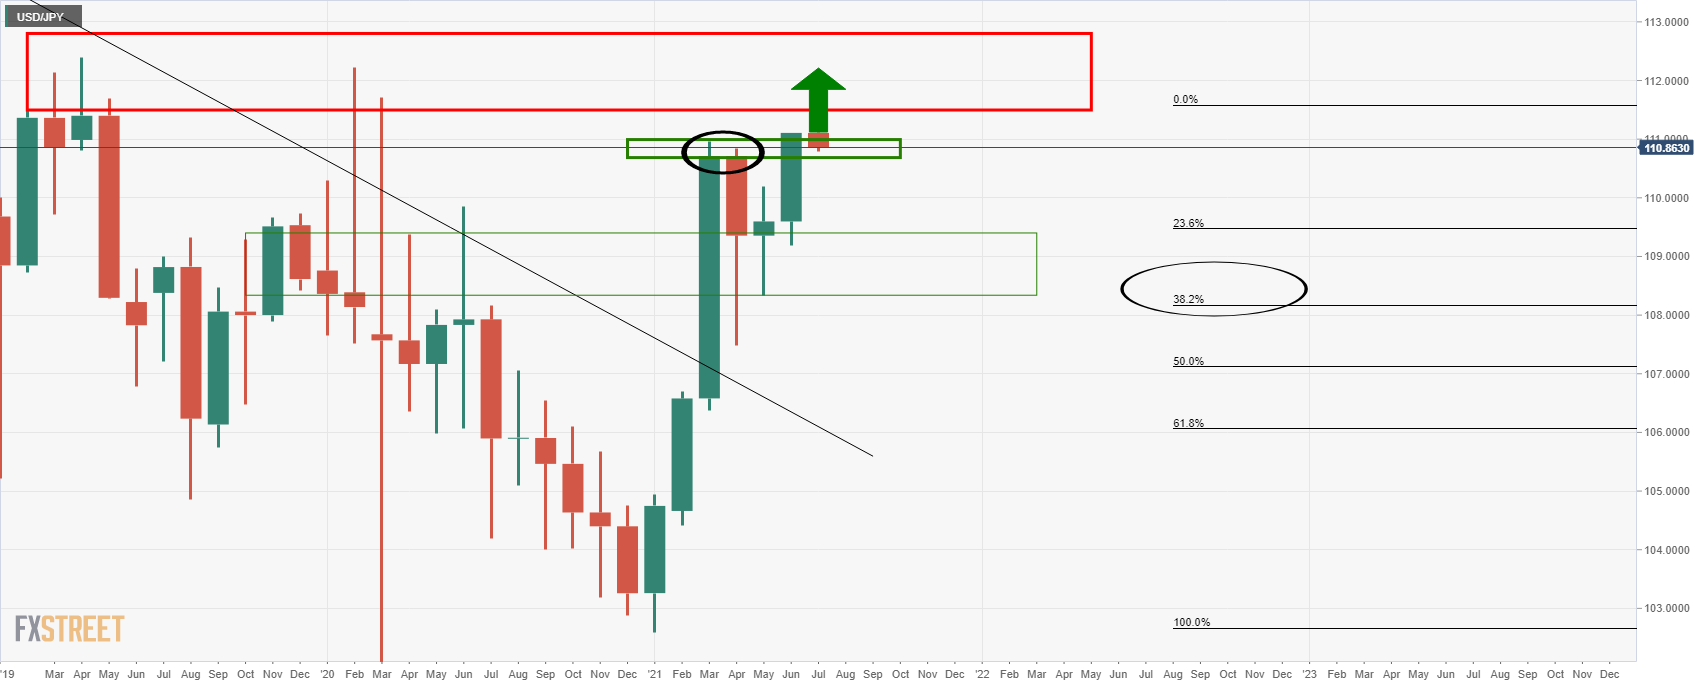
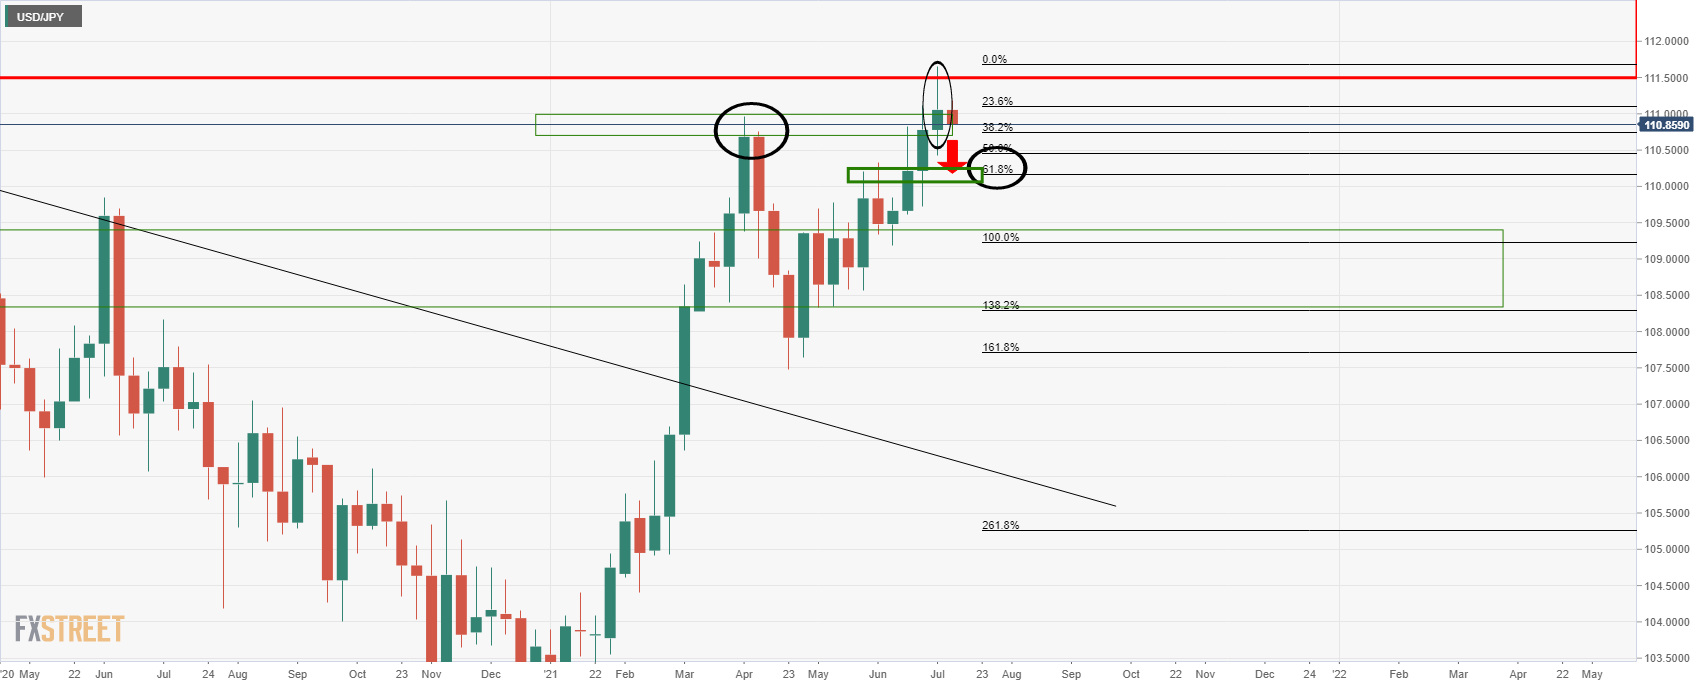
Weekly chart
The weekly close was also bullish:
The price was rejected at the start of the monthly resistance area, but that is not to say that the wick that was left will not be filled in in the forthcoming days on a retest of the upside.
However, given the monthly resistance, bulls may be resultant to commit to such a feat as to take on monthly resistance following last week's initial failure.
This could easily result in the following bearish scenario and retest of prior resistance and the confluence of a 61.8% Fibonacci retracement:
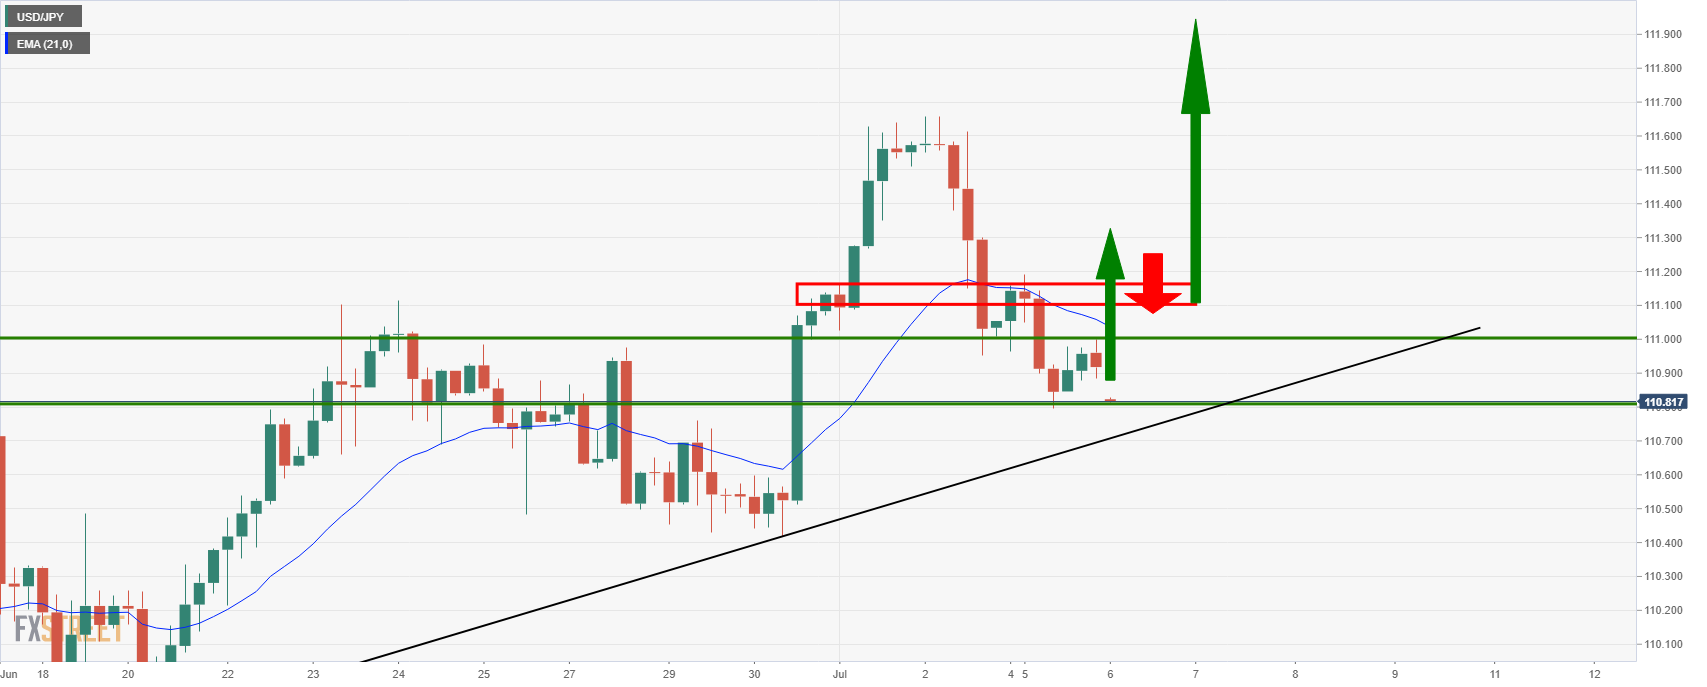
Daily chart, bullish prospects
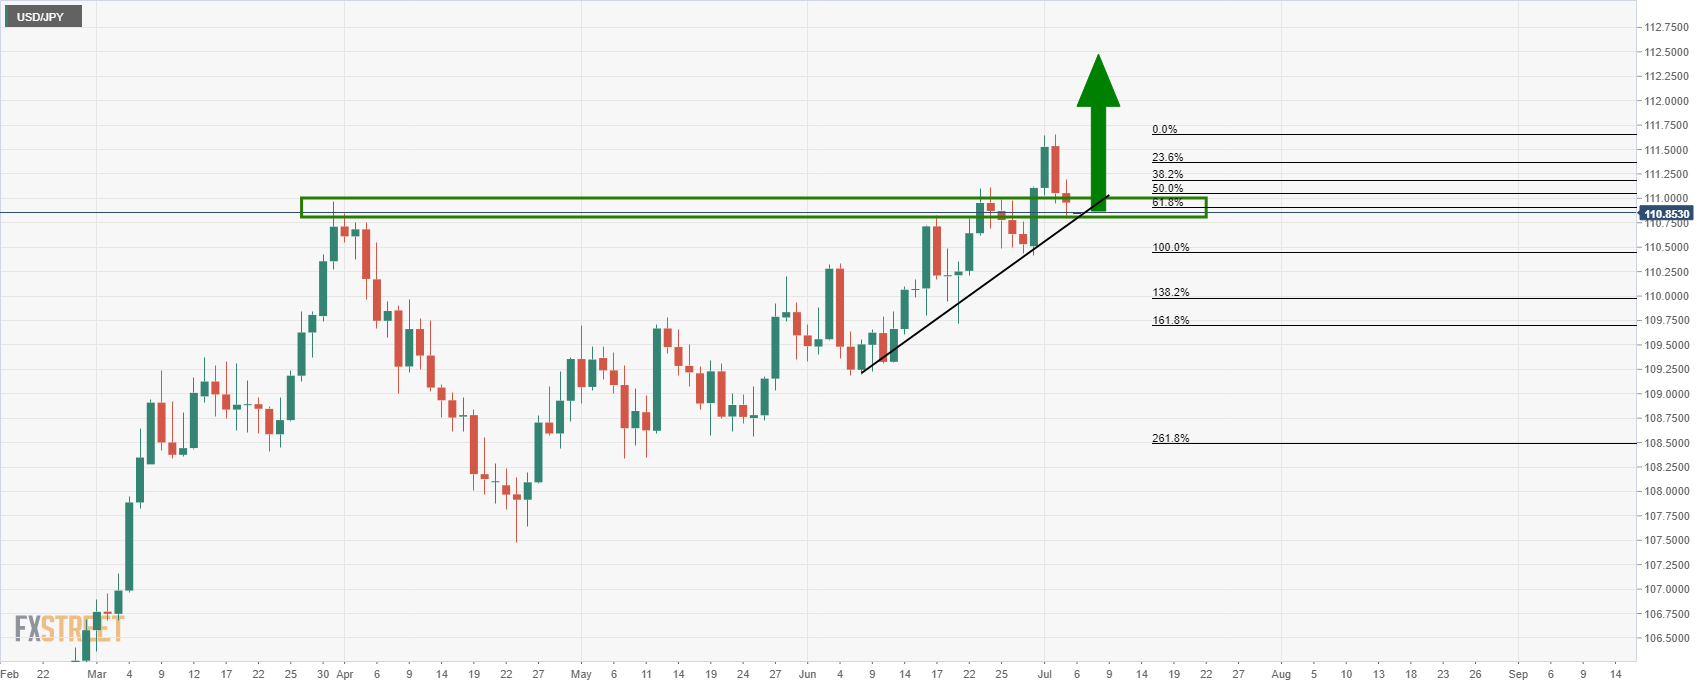
From a daily perspective, there is a bullish scenario from daily support and the confluence of the 61.8% Fibonacci from which bulls might wish to try out another test he monthly resistance from.
If the price moves higher, it will fill in the weekly wick and stand a good chance of penetrating deeper into monthly resistance, making for a fresh weekly and daily high.
111.90 marks the -272% Fibonacci retracement ahead of the 61.8% near 112.20 as potential target points for the bravest of the bulls.
In saying that, a trade can be taken from the next bullish structure at reduced risk in order to limit likely losses of failures beyond one's entry point.
For instance, a break of the 4-hour resistance at 111.20 would be bullish and potentially trigger enough renewed demand:
4-hour chart