
- USD/JPY snaps a five-day uptrend around a 20-year high.
- Multiple failures to cross 134.50 joins sluggish RSI to tease sellers.
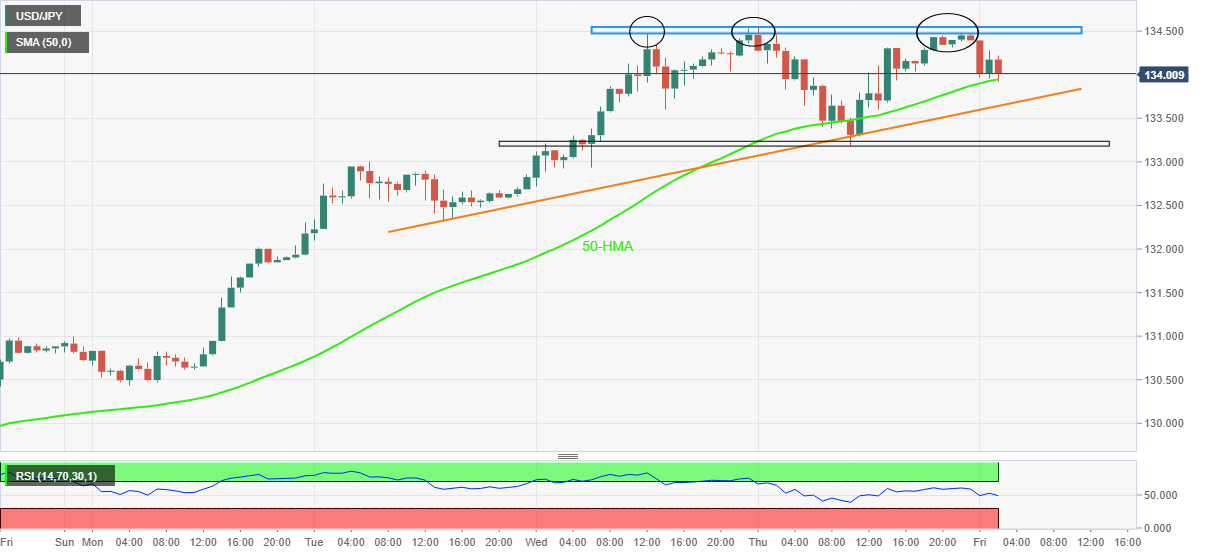
- Bears need validation from 133.18 to extend the fall.
USD/JPY consolidates recent gains around a two-decade high, refreshing intraday low near 134.00 during Friday’s Asian session.
The yen pair portrays a triple top bearish chart pattern on the hourly play. However, a clear downside break of the recent bottom surrounding 133.20 becomes necessary to recall the pair sellers. While facilitating the pair’s further fall, the RSI prints a downward trajectory.
That said, the 50-HMA and weekly support line, respectively near 133.95 and 133.65, could act as immediate supports during the quote’s further weakness.
In a case where the USD/JPY prices drop below 133.18, the weekly low of 130.43 could lure the bears.
Meanwhile, recovery moves remain elusive until the quote offers a sustained run-up beyond the 134.50 hurdle. Following that, 2002’s yearly top near 135.20 will gain the market’s attention.
Overall, USD/JPY bulls seem tired but the bearish trend is far from the reach.
USD/JPY: Hourly chart
Trend: Further weakness expected


