- The USD/JPY is set to end the week with gains close to 2%.
- The triple bottom chart pattern was fulfilled once the USD/JPY reached a YTD high above 117.00.
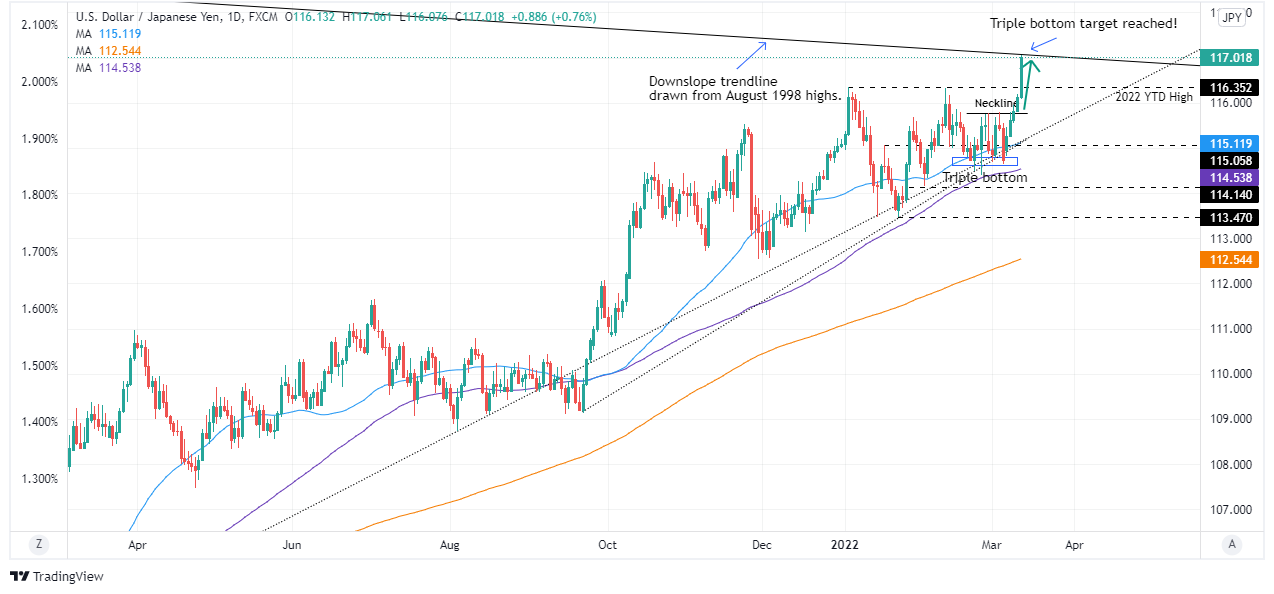
- USD/JPY Technical Outlook: Upward biased, but downside risks remain as a 24-year-old downslope trendline near 117.00 looms.
The USD/JPY is ready to finish the week on a higher note, on a risk-on market mood, underpinned by higher US Treasury yields, led by the 10-year T-note sitting at 2.01%. At the time of writing, the USD/JPY is trading at 117.00.
Risk appetite increased during the European session when Russian President Putin expressed that has been a “certain positive shift” in talks with Ukraine while keeping hopes of a possible meeting with his counterpart, the Ukrainian President Zelensky, alive.
Aside from this, the greenback remains firm during the North American session. The US Dollar Index, a gauge of the buck’s performance vs. a basket of six rivals, keeps heading north, up 0.23%, sits at 98.756, a tailwind for the pair.
Overnight, the USD/JPY followed the path of least resistance, continuing the uptrend. It is worth noting that the triple-bottom chart pattern target at 117.00 was fulfilled, as the pair’s daily high, which also is a YTD high was 117.06.
USD/JPY Price Forecast: Technical outlook
The USD/JPY remains upward biased, though traders need to be aware of a trendline that travels from August 1998 highs, a 24-year-old downslope trendline, which could be difficult resistance to overcome by USD/JPY bulls.
That said, the USD/JPY first resistance would be 117.00. Breach of the latter would expose the 118.00 mark, followed by January 17, 2021, high at 118.61, and then the 119.00 mark.