

WASHINGTON (AP) — President Joe Biden on Tuesday (23 November 2021) ordered a record 50 million barrels of oil released from America's strategic reserve, aiming to bring down gasoline and other costs, in coordination with other major energy consuming nations including India, the United Kingdom and China.
The gasoline prices were aimed to increase the US economy but in that day the trading market conditions were slightly negative for US dollar, obviously the trend can not be determined by the few trading days after the fundamentals. The Canada is one of the major suppliers of oil to the US economy, so if USA uses their reserves they will most likely do more purchasing from Canada and that means more US dollars that will flow to Canada and that will increase Canadian economy.
Monthly Chart
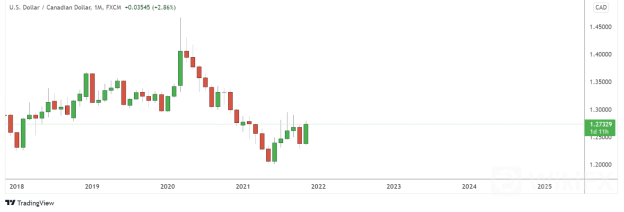
As we are approaching the month end of November. The last bullish candle will close soon. In most cases when we start a new month, usually a candle has wicks and a wick on Monthly chart might be a whole retracement on a smaller timeframe. So, when the month of December starts, we might see a retracement to the bearish side, but there is nothing confirmed at the moment, let us see lower timeframes for more clear details.
Weekly Chart
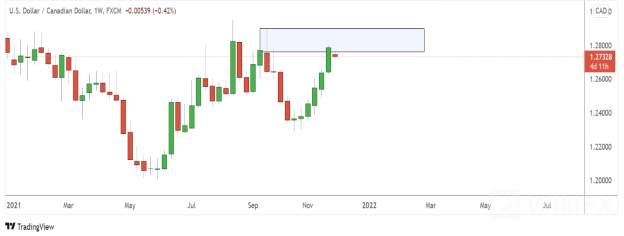
Weekly chart looks like it has tapped the supply zone but it has not been respected as yet, if you look closely the new weekly candle opened with a gap to the downside, there is not much to base on this zone as yet because it has not played out and it could take weeks for this zone to even unfolds.
Daily Chart

Now we can see more details in this chart. There is a BOS (Break of Structure), there is a break of trend line, there is a new HL (Higher Low) point that has been formed at the top part of that supply zone, but at the moment we are still more bullish than bearish.
H4 Chart

This chart is still more bullish, because it is still forming HH (Higher Highs) and HL (Higher Lows) the entire time, as much as this pair is at a daily and weekly supply zone it does not mean anything if this pair is continuing to form HH‘s and HL’s. The four-hour trend line is still relevant but when this trend line breaks, we will know that the momentum is slowly changing, but the most important one is the structure as a whole, if this structure is not broken there is the greatest number of chances for the bullish trend to continue.
Hourly Chart

This is still bullish trend on a minor retracement, as much as there is a single LH (Lower High) point that has been formed, but that does not mean anything if they do not break the structure point, that has been formed where there is a black support line.
This pair is still bullish more than anything because it has not yet given us factors that it is ready to go short, if it passes the supply zone we might as well conclude that it is not ready to go short as yet, and that would mean that the plan for US president would have worked better, there is also a lot that affects the US economy, so if you are trading it is much better to combine fundamentals and the technical for a better understanding. Download WikiFX app for more updates on this index.


