
- VeChain price finally catches the same bullish momentum that Bitcoin and the majority of the market have captured.
- Extremely bullish breakout setup on the $0.002/3-box Point and Figure Chart.
- 33% upside potential, 33% downside potential.
VeChain price has an extremely favorable setup on its $0.002/3-box reversal Point and Figure Chart. The implied target area from a breakout is a 4.75:1 reward to risk ratio, representing one of the best bullish opportunities in the altcoin space.
VeChain price locked and loaded for some explosive movement higher – but bears have swiped price lower during the trading session
VeChain price is currently up against a potentially massive bullish breakout zone. On the Point and Figure chart, VeChain has a split double-top formed at $0.116. This split-double top forms as the last resistance level just below the current dominant bear market angle (red diagonal line).
The entry point for buyers is one box above the split-double top: $0.118. $0.118 is not only the break above the split-double top, but it would also break the current bear market angle and convert the VeChain price Point and Figure chart into a bull market, with a new bull market trendline developing from the $0.088 value area. Utilizing the vertical profit target method in Point and Figure analysis, the projected profit target zone from a $0.118 entry is $0.154.
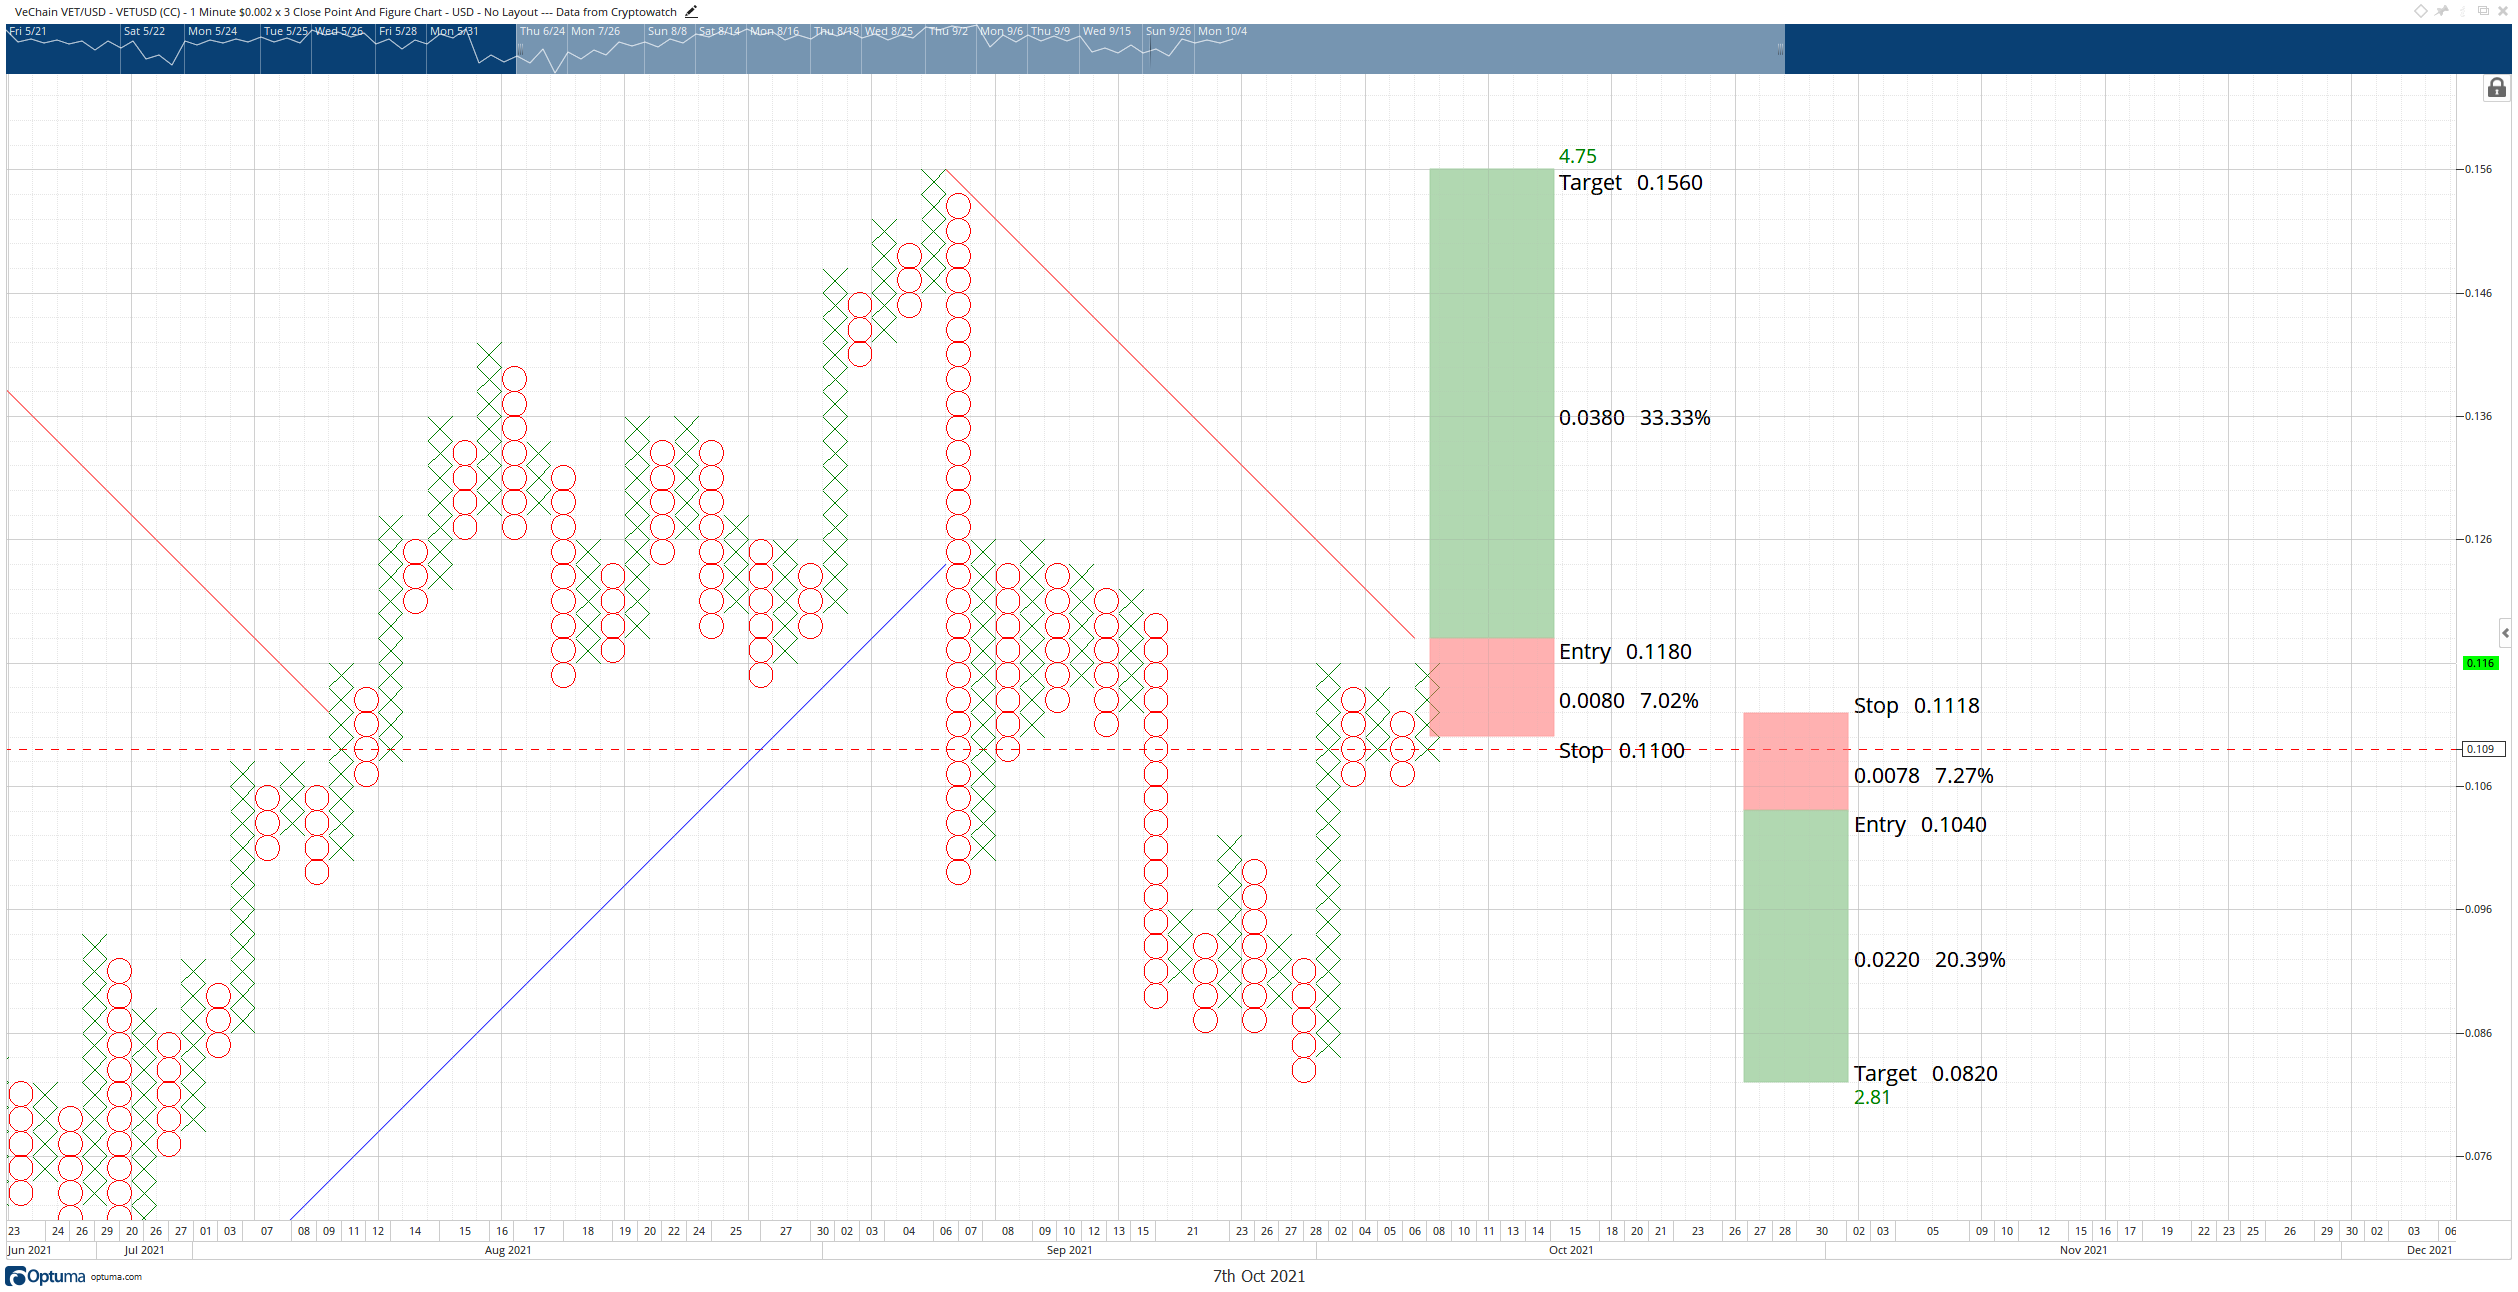
VET/USD $0.002/3-box reversal Point and Figure Chart
However, bulls should be aware that any rejection against $0.118 could trigger a bull trap. If a new column of O’s were to form, then one of the most ideal bearish setups in Point and Figure analysis could develop: the triple-bottom. The triple-bottom would form at $0.106 with an entry one-box below at $0.104. The projected zone for short-sellers would be a return to the most recent swing lows near $0.084.


