
- XLM price trades to a different tune as it tries to sustain price above a symmetrical triangle’s lower trend line.
- Stellar 200-day simple moving average (SMA) looms large over any price traction that may emerge.
- Volume runs well below the 50-day average, revealing no accumulation or distribution by investors.
XLM price has been propped up by the symmetrical triangle’s lower trend line and 61.8% Fibonacci retracement level of the March 2020-May 2021 rally. However, the resulting rebound has been limited, unaffected by the Bitcoin burst higher since the El Salvador announcement to make BTC legal tender. Without a daily close above the 200-day SMA at $0.379, the cryptocurrency price path will be carrying a downward bias.
XLM price decoupling from Bitcoin follows altcoin script
XLM price correction in May was a wicked reminder of the risks inherent in cryptocurrency investing, as Stellar collapsed 65% into the May 23 low. Not only did it remove the pockets of anxiety and weak holders, but the decline also abolished a historic rally from the March 2020 low.
The proceeding price action has taken the form of a symmetrical triangle as XLM price has oscillated in a tighter range with noticeably lower than average volume. The current location of Stellar below the 200-day SMA and the triangle’s upper trendline, which just crossed below the moving average, presents a challenge for bullish Stellar investors.
The measured move of the symmetrical triangle is nearly 50%. A resolution to the downside could motivate an XLM price decline to $0.166, which is well below the 78.6% retracement of the March 2020-May 2021 advance. It would be a significant blow to Stellar; a network envisioned to boost financial inclusion by reaching the world’s unbanked.
To confirm a resolution to the downside, XLM price needs a daily close below the June 12 low at $0.300. It would almost guarantee a sweep below the May 23 low of $0.274 and raise the odds that Stellar will resume the brutal correction, potentially to the measured move target of $0.166.
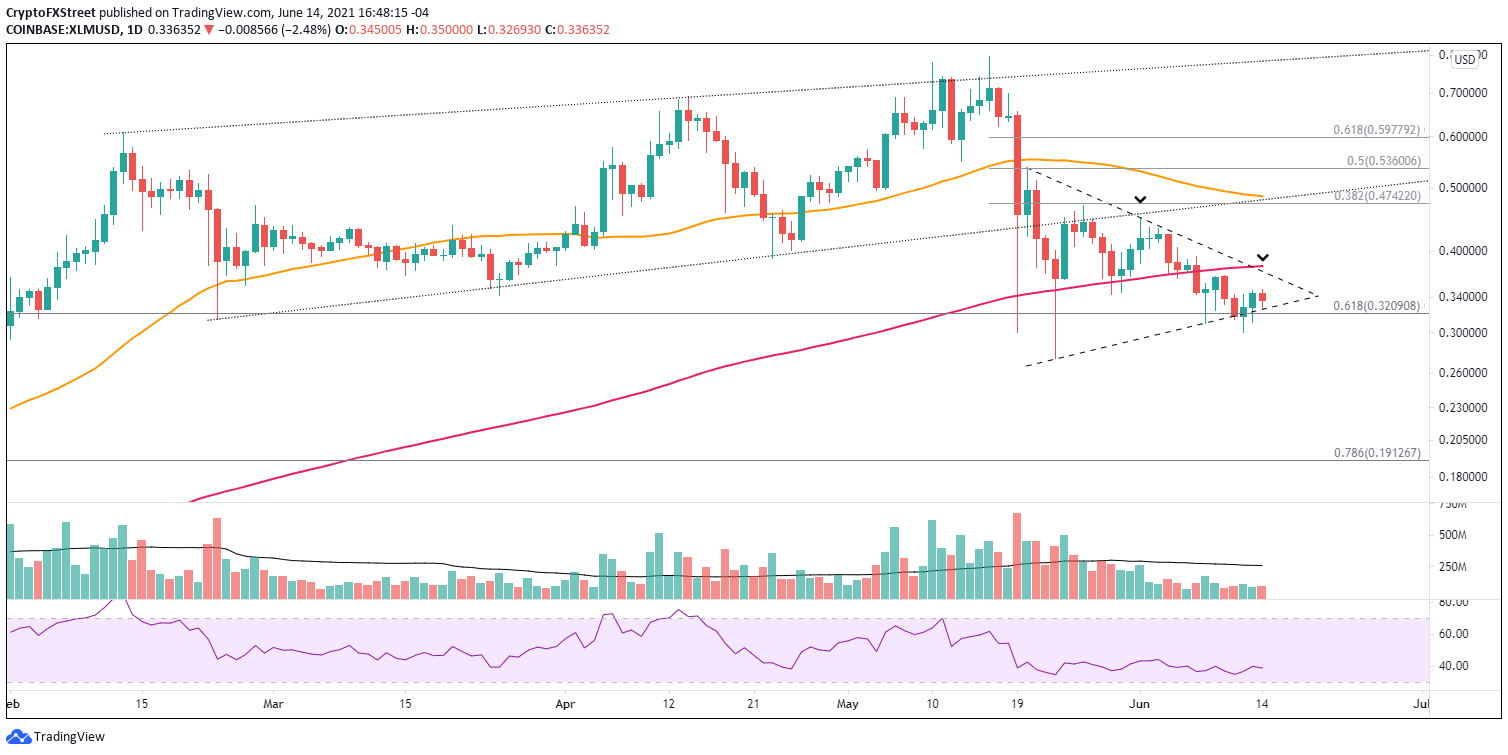
XLM/USD daily chart
XLM price can avoid a bearish fate by beginning with a daily close above the triangle’s upper trend line and the dominant 200-day SMA, currently at $0.379. After that, Stellar would be free to rally to the intersection of the 38.2% retracement of the May correction at $0.474 with the declining 50-day SMA at $0.486. Thus, it would be a 30% gain for timely Stellar investors.
Like other altcoins, XLM has struggled to break the bounds of a symmetrical triangle and the resistance enforced by the 200-day SMA. As a result, the outlook for Stellar also is not much different, neutral with a bearish tilt.


