
- XLM price action consistently is an underperformer amongst its peers.
- XLM is one of the few big-name cryptocurrencies that has not made new all-time highs (last was January 2018).
- Upside potential remains high despite a likely pullback.
XLM price continues to pull back from the highs it made on Saturday. There are growing concerns regarding its ability to maintain its present momentum.
XLM price may pullback to test $0.34 as support before resuming move to $0.57
XLM price has a very bullish set up on its $0.01/3-box Point and Figure chart. When XLM hit the $0.42 price level, that was the breach of the dominant bear trend angle on the Point and Figure chart. The result was a shift from bear market conditions to bull market conditions. Additionally, the pattern created a Pole Pattern.
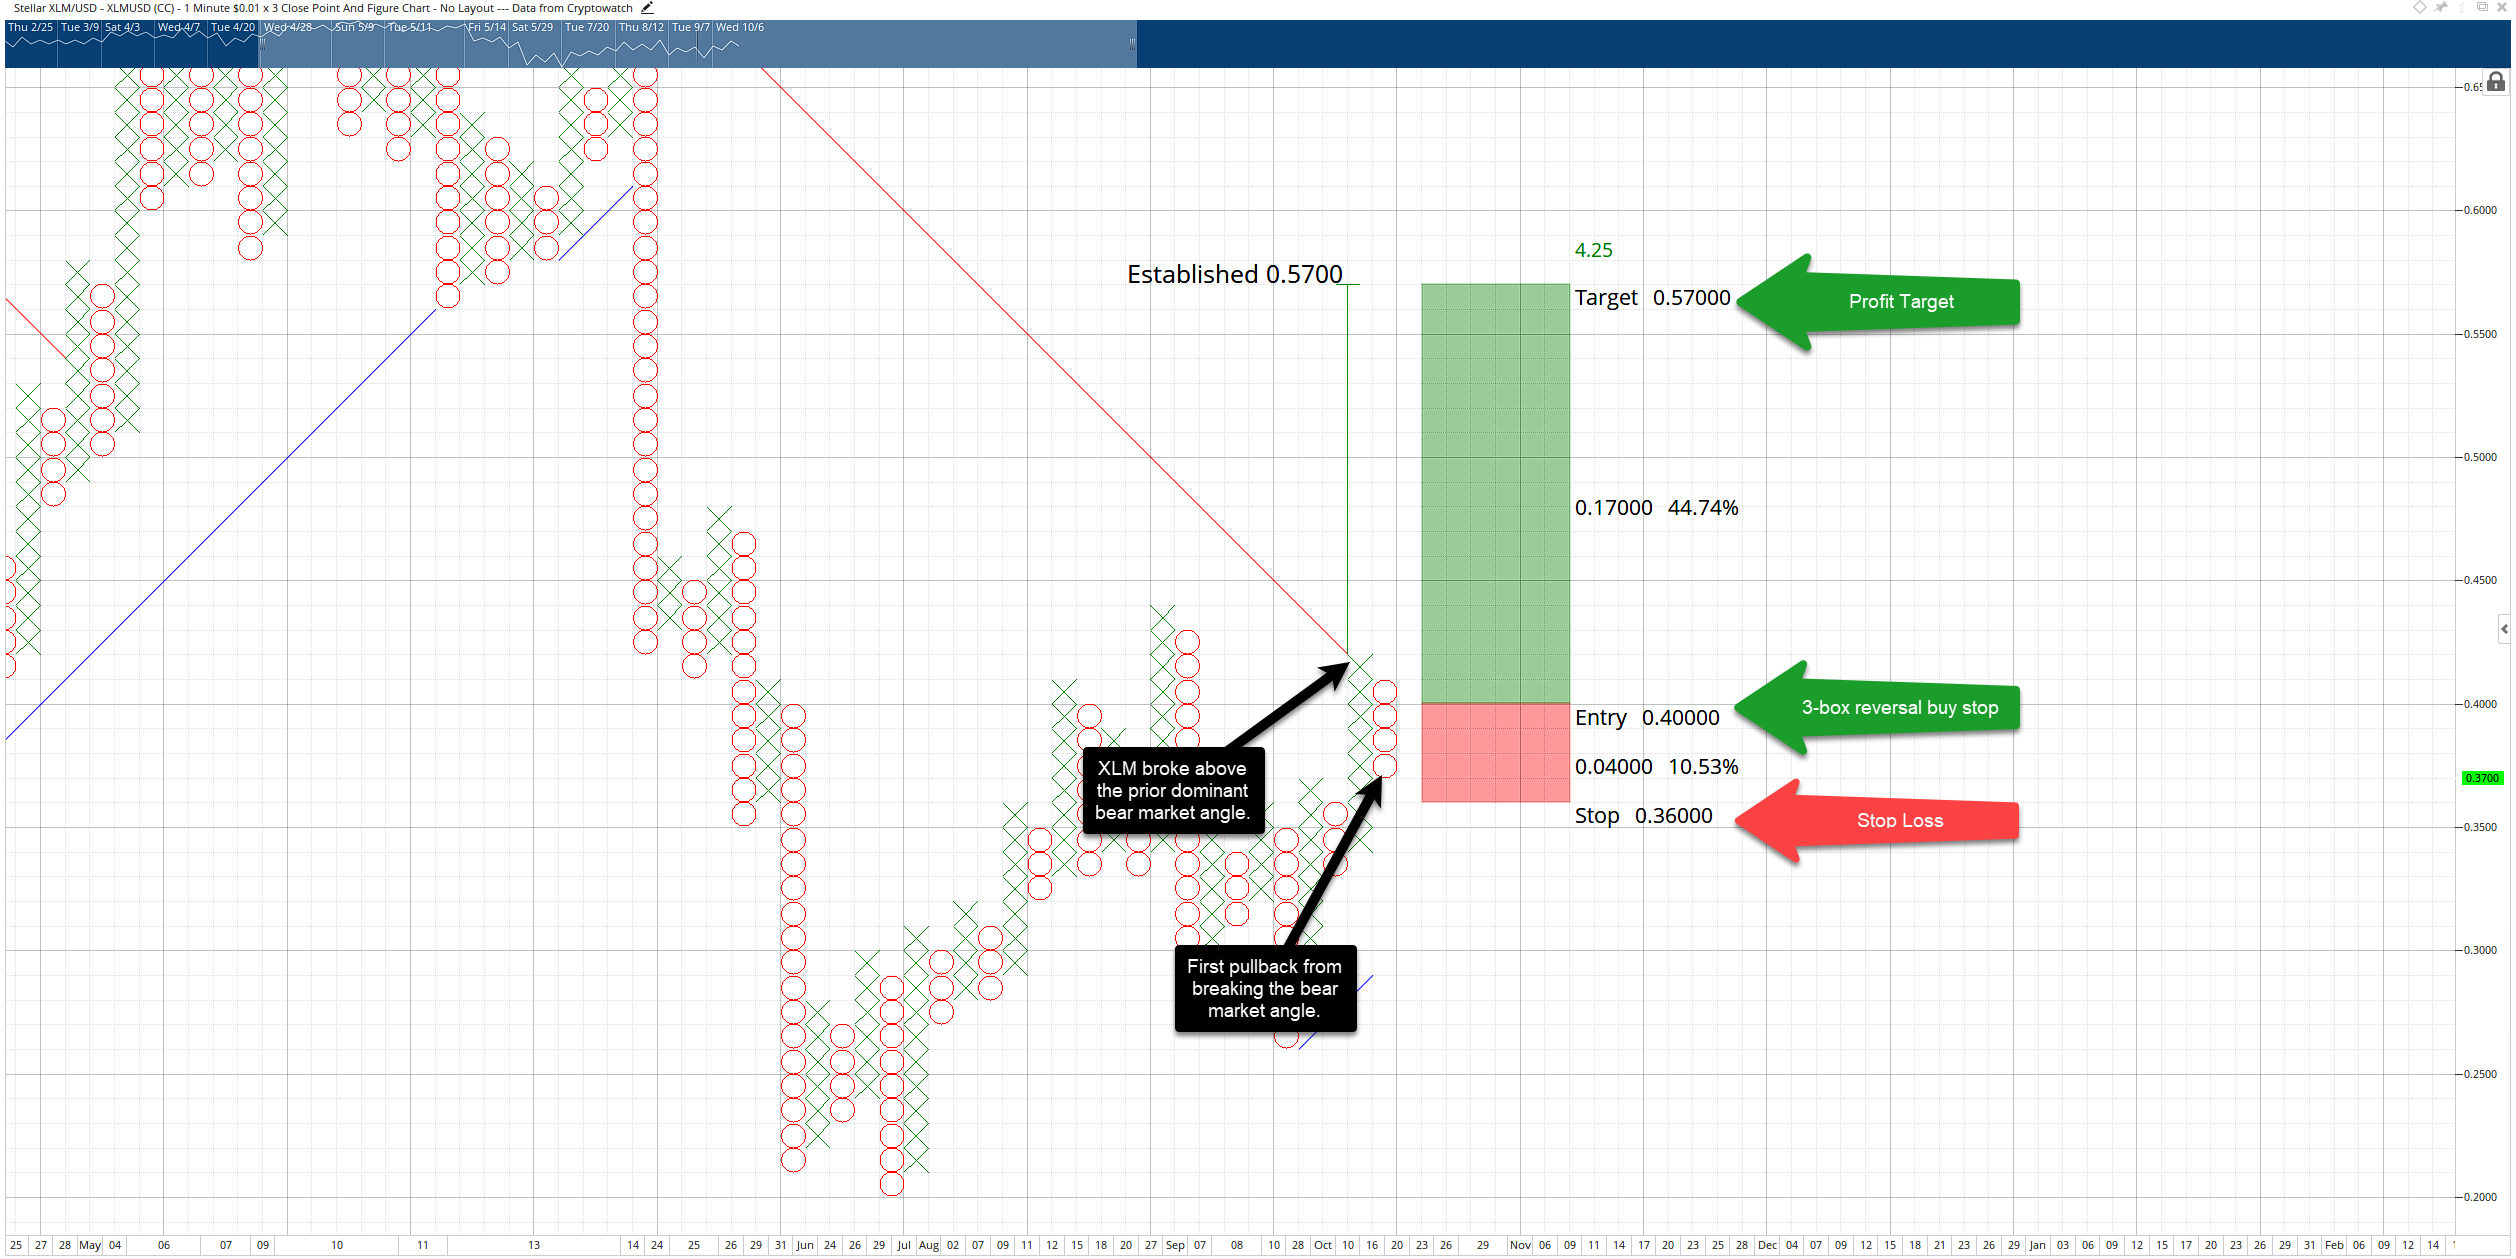
XLM/USD $0.01/3-box Reversal Point and Figure Chart
The hypothetical long opportunity from the Pole Pattern is an entry at the 3-box reversal ($0.40 at the time of posting). Bulls would look for a buy stop order at $0.40 with a stop-loss order at $0.36. The vertical profit target method in Point and Figure analysis points to XLM price at $0.57 for the profit target.
To invalidate the current bullish setup on the Point and Figure chart, bears will need to push XLM price a lot lower. The current price action suggests that a pullback to Senkou Span B and the Kijun-Sen is likely (both are within the $0.34 value area). Beyond that, bears would need to close XLM price below both the 38.2% Fibonacci retracement and the Cloud at $0.31 to return the market to a bearish outlook.
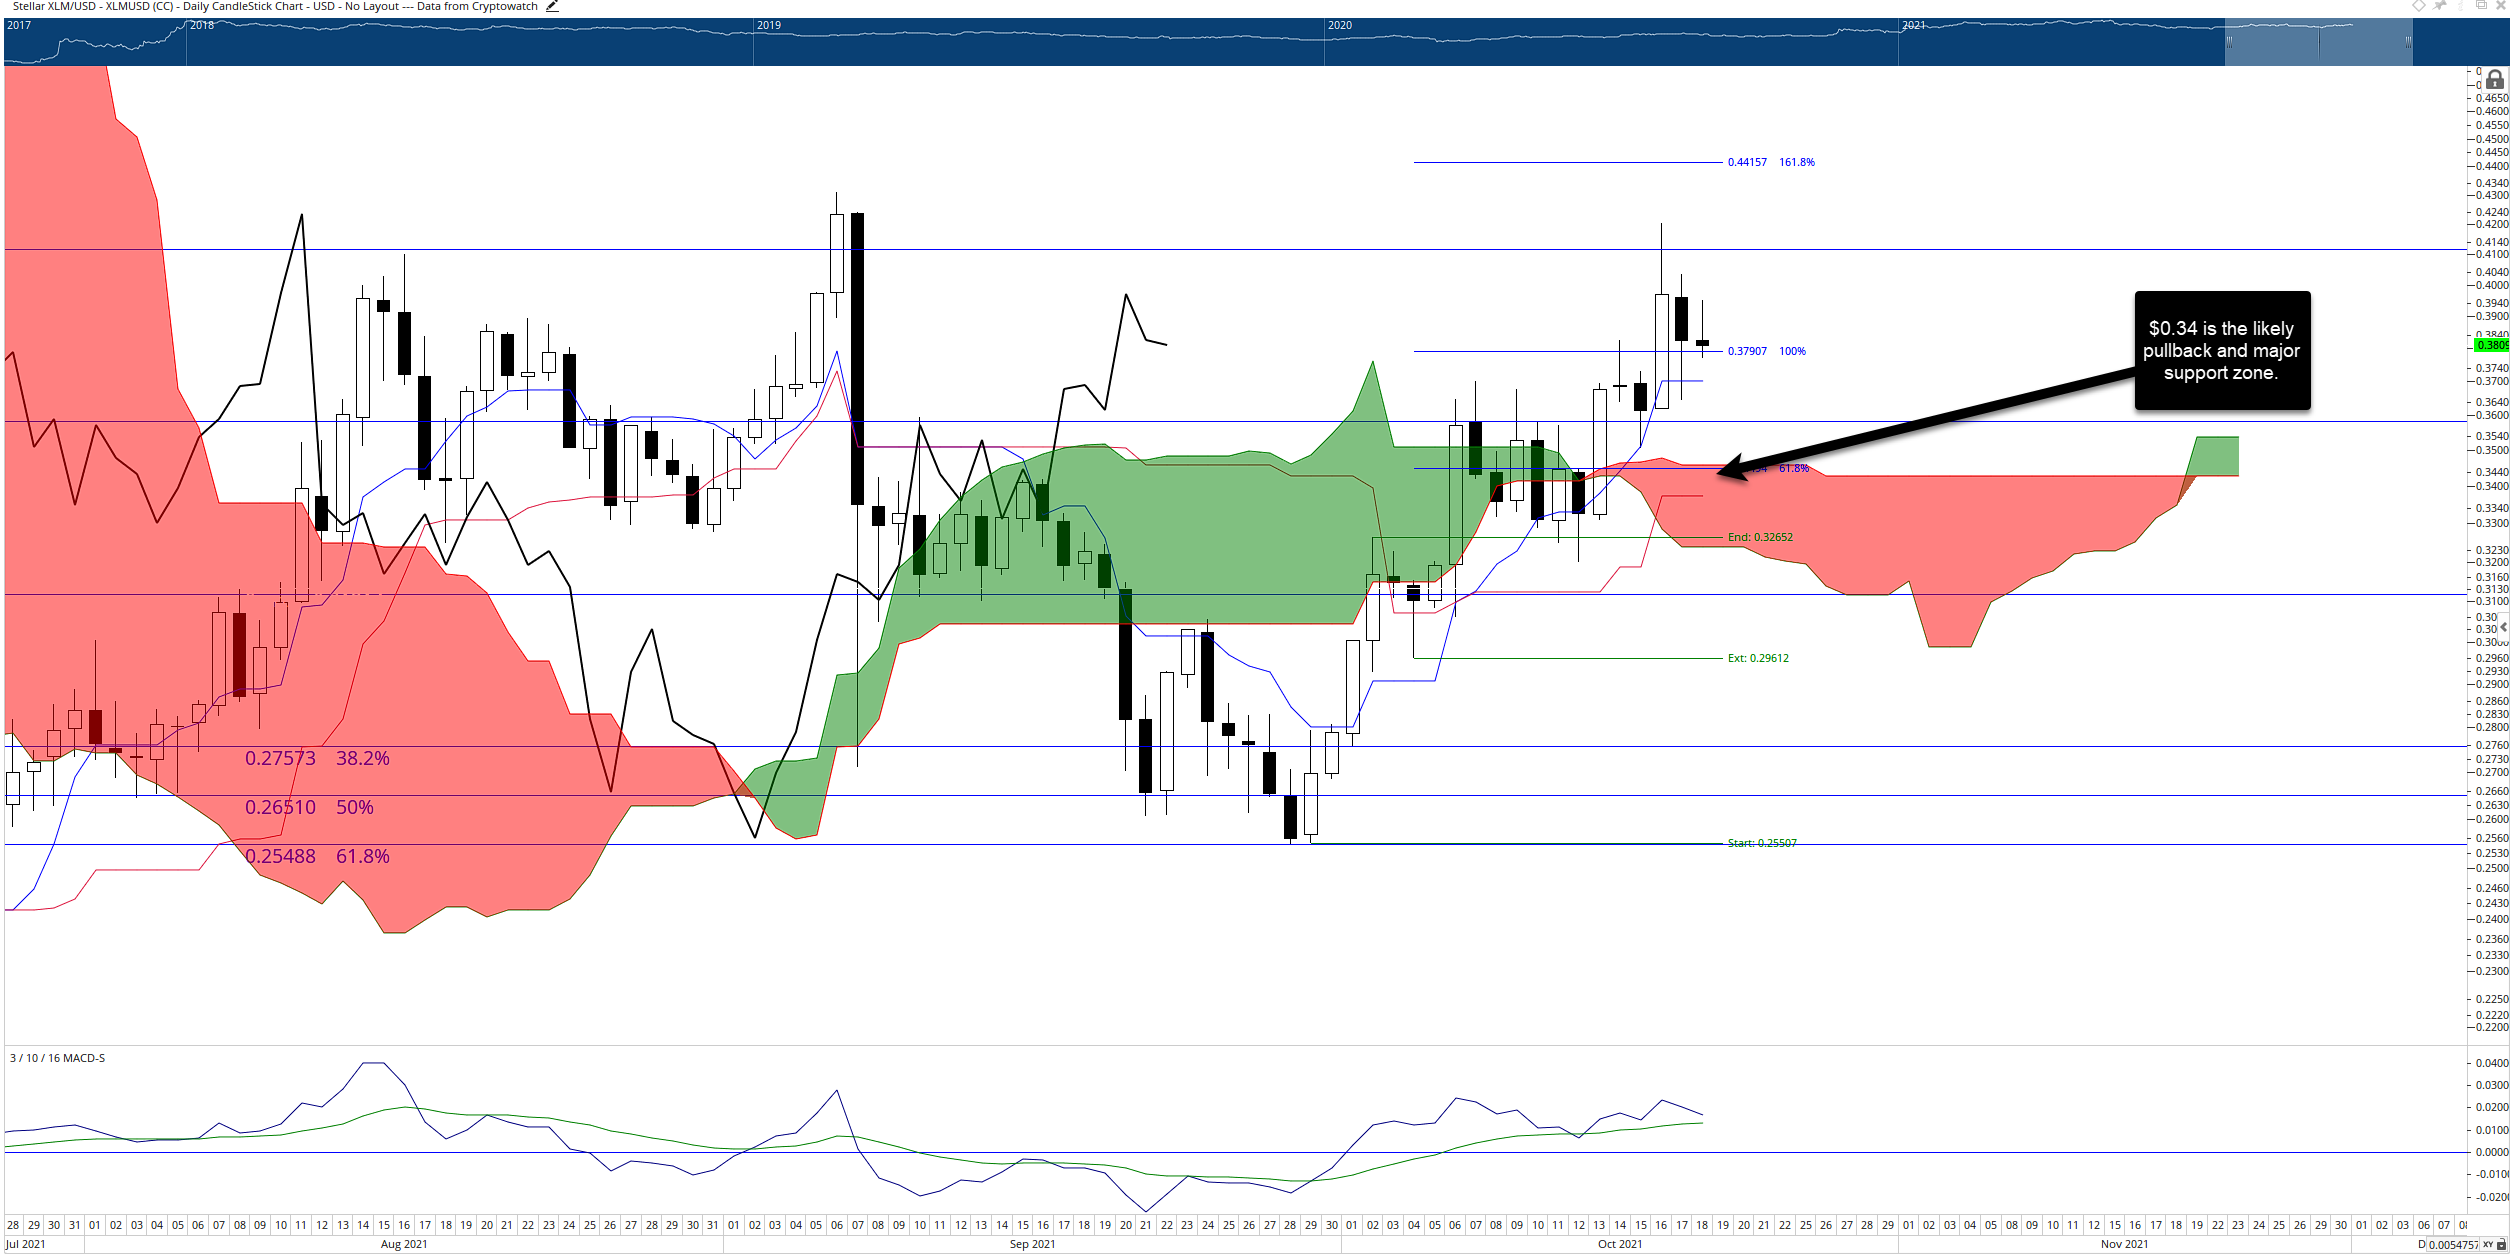
XLM/USD Daily Ichimoku Chart
However, bears may have difficulty pursuing prices below $0.31 because the second-largest high volume node in the 2021 Volume Profile is within the $0.31 value area.


