
- XRP price has been stuck within a consolidation pattern, indicating indecision.
- However, Ripple is ready for a big move to the upside as it inches closer toward a critical resistance level.
- The governing technical pattern suggests that XRP price could be headed for a 26% climb, but critical resistances may hinder its rally.
XRP price appears to be headed for a 26% climb, but the hopes of a Ripple rally could be hampered by the multiple resistances that stand in the way of the bullish target. The cross-border remittance token could find substantial support, should the optimistic outlook be ruined.
XRP price struggles with indecision ahead of big move
XRP price has printed a symmetrical triangle pattern on the 4-hour chart, implying that there is a general equilibrium between buyers and sellers. The heightened level of indecision may soon be over as the squeezing of the Bollinger Bands hints that Ripple could be awaiting a big move.
The governing technical pattern indicates that XRP price could either target a 26% upswing or a 26% descent from the current levels. However, the bulls are prevailing as Ripple is nearing the topside trend line of the triangle.
Adding credence to the bullish forecast is the Arms Index (TRIN), which gauges the overall sentiment of the market. The indicator suggests that there are more buyers in the market than sellers.
Should XRP price slice above the upper trend line of the chart pattern, this could open up the possibility of Ripple reaching its optimistic target of a 26% climb to $1.40. However, before the altcoin would be able to set foot on this level, there are multiple obstacles that the bulls should be aware of.
The first hurdle for XRP price is at $1.17, where the 100 four-hour and 200 four-hour Simple Moving Averages (SMAs) coincide. The following resistance will emerge at the 78.6% Fibonacci retracement level at $1.21. Another obstacle may emerge at $1.30, the August 23 high.
Only if XRP price overcomes all of the aforementioned resistance levels would Ripple ascend 26% to $1.40.
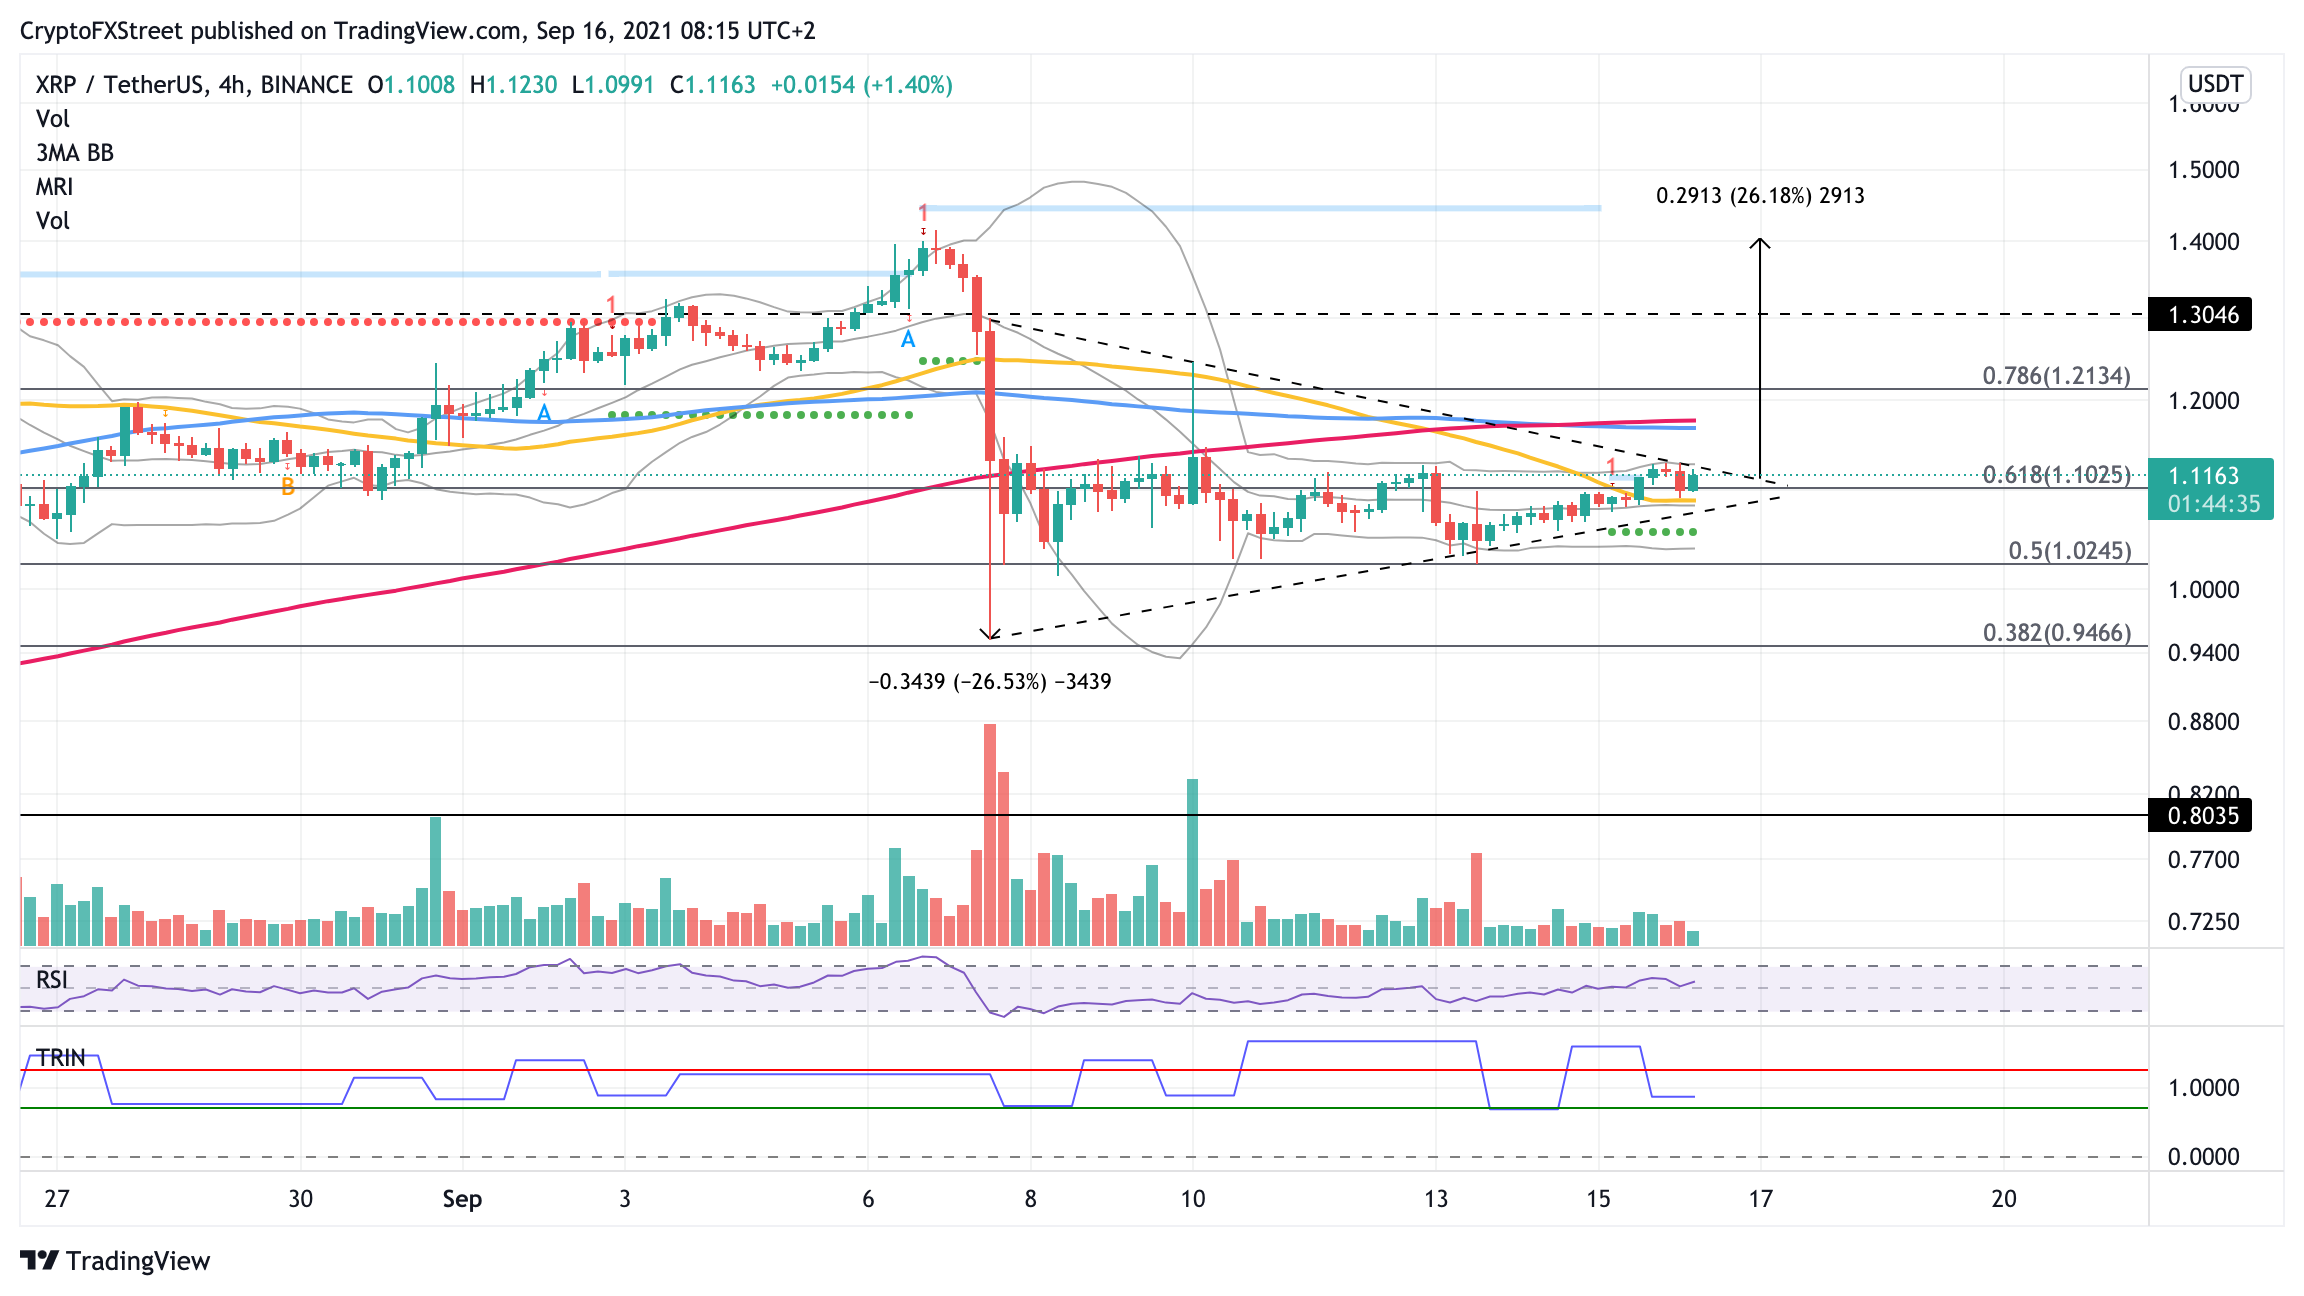
XRP/USDT 4-hour chart
However, the chart pattern also suggests that XRP price could be headed for a 26% plunge. Before the bearish target of $0.80 can be on the radar, Ripple may discover immediate support at the 61.8% Fibonacci retracement level at $1.10, then at $1.08 at the 50 four-hour SMA.
Further lines of defense may emerge at the lower boundary of the symmetrical triangle at $1.07, then at the support line given by the Momentum Reversal Indicator (MRI) at $1.05.
Should an unfortunate turn of events occur for XRP price, Ripple could find additional support at the 50% Fibonacci retracement level at $1.02, then at the 38.2% Fibonacci retracement level at $0.94.


