
- XRP price strikes support at the support framed by the 38.2% Fibonacci retracement at $1.06 and the psychologically important $1.00.
- Ripple defining a symmetrical triangle continuation pattern on the intra-day charts.
- Golden Cross signal looming as the 50-day simple moving average (SMA) approaches the 200-day SMA.
XRP price has spent this week consolidating last week's 65% gain while testing the validity of the support now offered by the psychologically important $1.00 and the 38.2% retracement at $1.06. The consolidation has taken the form of a symmetrical triangle pattern on the intra-day charts, projecting bullish outcomes for Ripple moving forward.
XRP price quietly waits for a resurgence of buyers
XRP price has climbed 160% from the July 20 low to the August 15 high, busting the omnipresent resistance attributed to the inverse head-and-shoulders neckline and the 200-day SMA, and carrying Ripple to the 50% retracement of the April-July cyclical correction at $1.23.
The ongoing consolidation that has followed the extreme overbought reading on the daily Relative Strength Index (RSI) is designing a symmetrical triangle continuation pattern between the 38.2% retracement and the 50% retracement levels.
The measured move of the symmetrical triangle is 22% from the descending trend line, forecasting an XRP price target of $1.54. A test of the measured move target of $1.54 would overcome resistance at the 61.8% extension at $1.40 and place Ripple close to the 78.6% retracement at $1.65.
A breakout from the symmetrical triangle in the next few days would coincide with a bullish Golden Cross pattern on the daily chart, increasing the confidence in the breakout and rally.
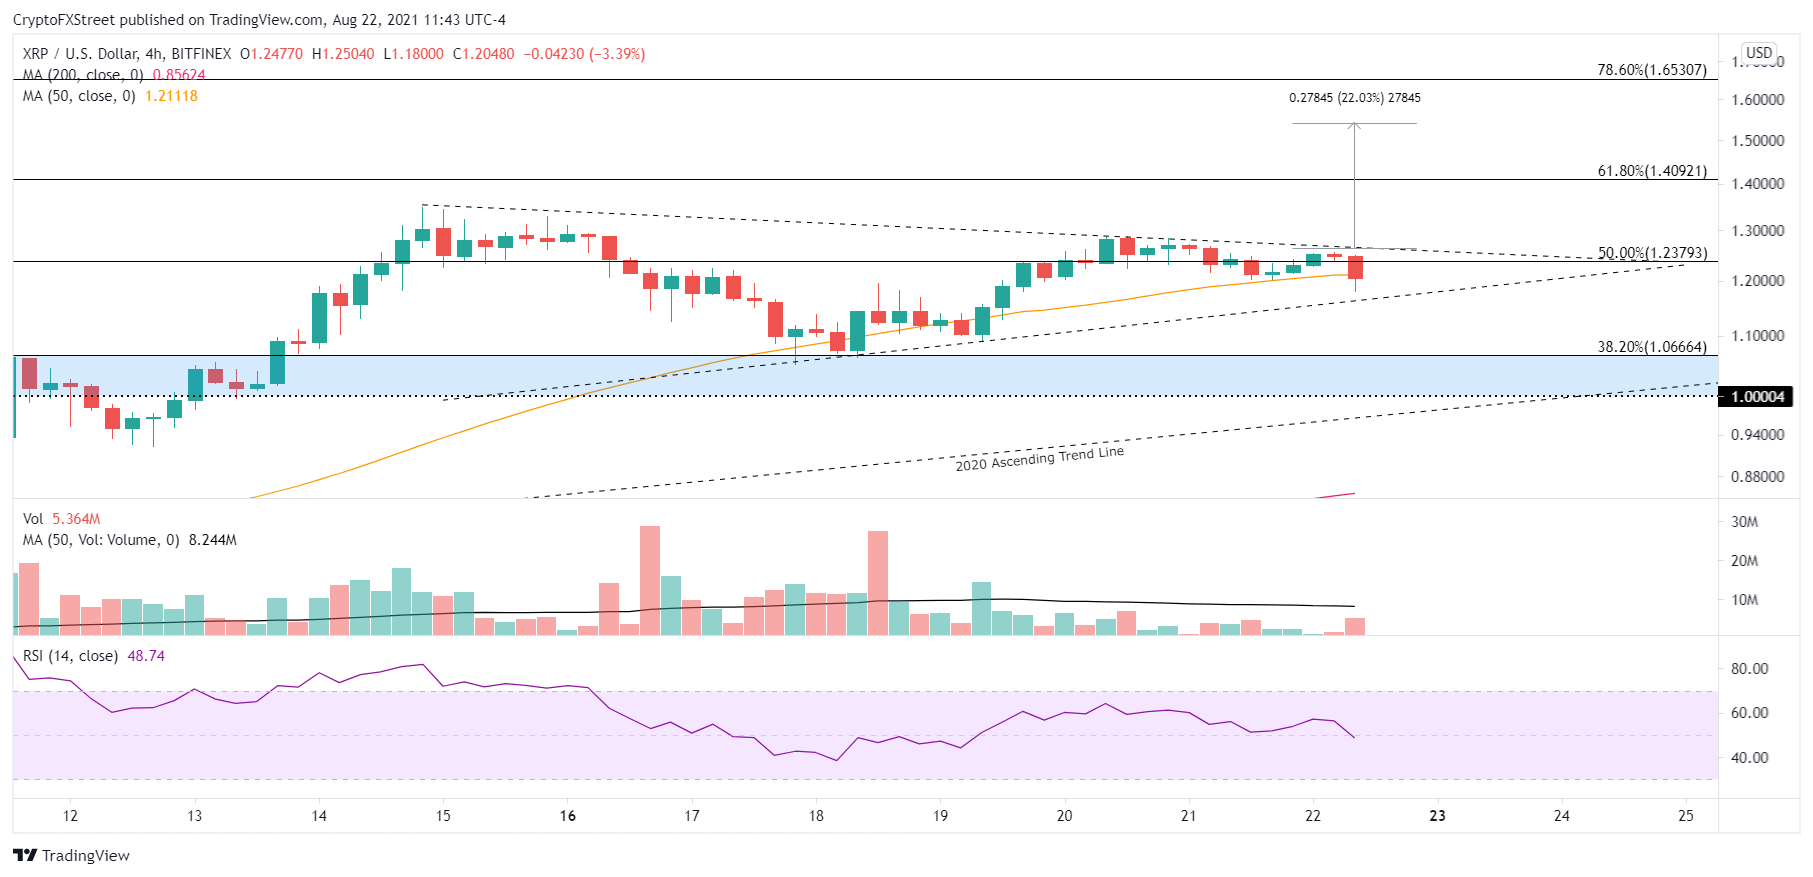
XRP/USD 4-hour chart
As part of the consolidation, Ripple has released some of the price compression generated by the 160% advance. The daily RSI has now fallen out of the overbought territory, creating the space for a new surge of momentum and higher prices.
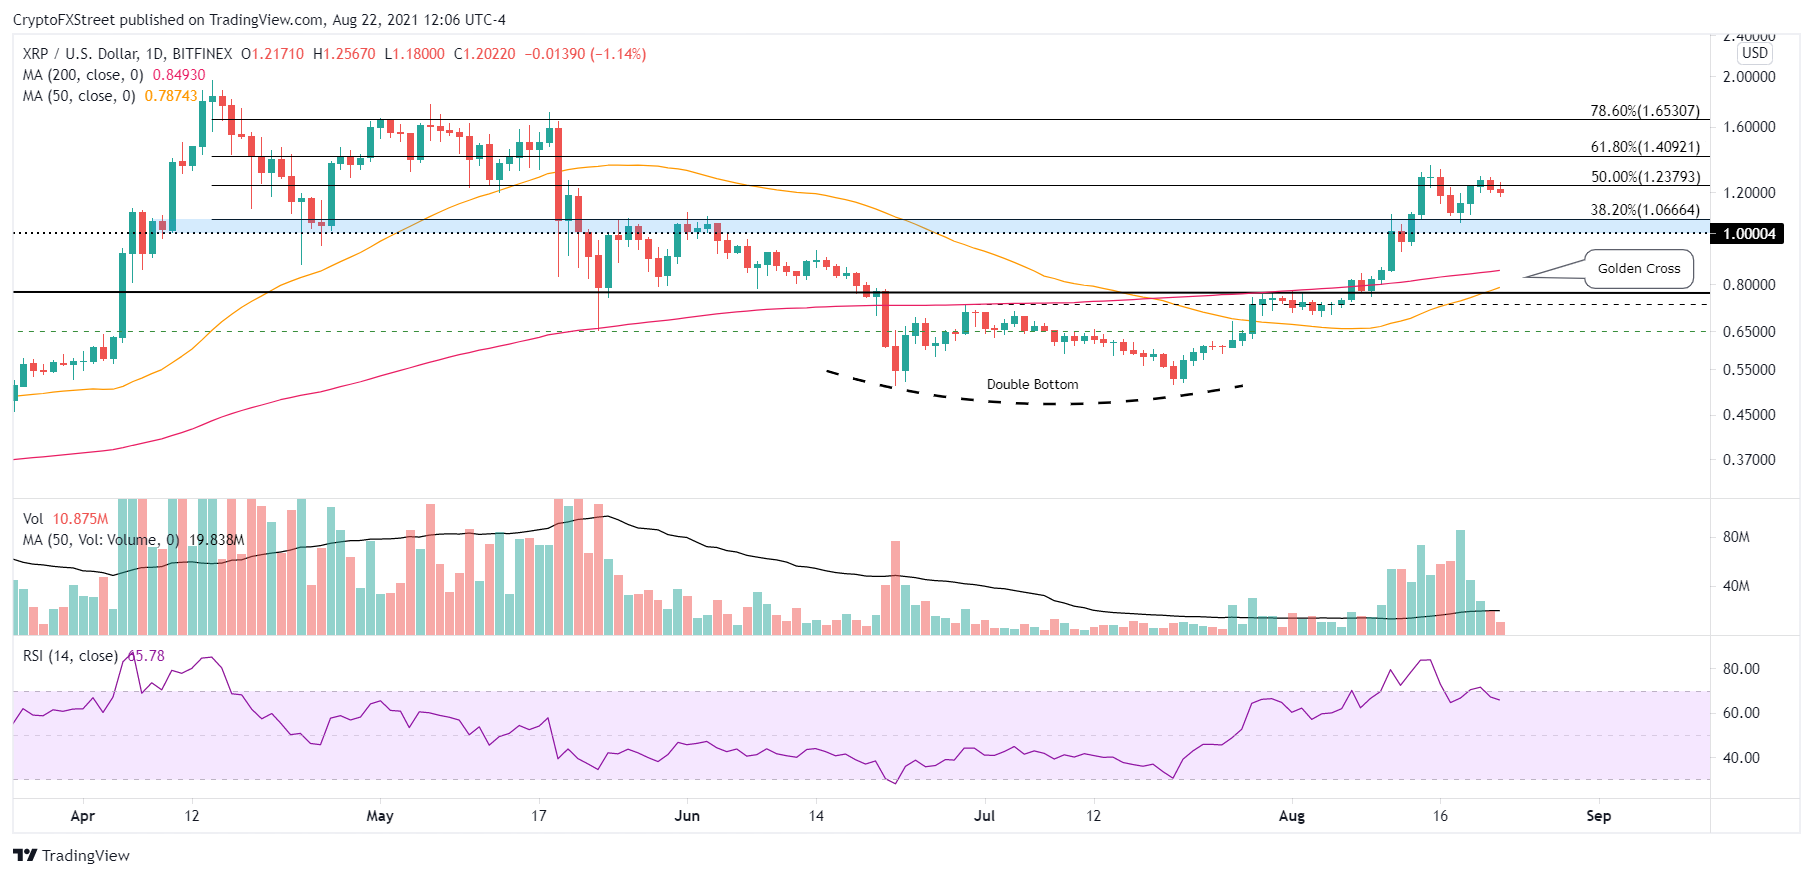
XRP/USD daily chart
Fundamental to the bullish outlook is the strength of the $1.00-$1.06 support. A daily close below the range would introduce a bearish twist that may jeopardize the rally’s sustainability. Downside targets include the 200-day SMA at $0.84 and the 50-day SMA at $0.78.
XRP price continues to flex a bullish posture, discovering support at a crucial support range, releasing price compression and plotting a bullish continuation pattern. The measured move target is $1.54, but based on the persuasiveness of the rally to date, Ripple should have no difficulty reaching $1.65 before a meaningful pullback will materialize.
Here, FXStreet's analysts evaluate where Ripple could be heading next as it seems primed to breakout.


