
- GBP/USD continues to run into offers near 1.3780 amid quiet trading.
- Barash 100-SMA on the 4H chart is a tough nut to crack for GBP bulls.
- RSI has turned south but holds above 50.00, backing the latest leg down.
GBP/USD is on a steady decline towards 1.3750, reversing Friday’s rally to weekly tops of 1.3781.
The holiday-thinned market conditions combined with a tepid bounce in the US dollar is collaborating with the downside in the cable. Renewed concerns over the post-Brexit visa-
As observed on the four-hour chart, the downward-sloping 100-Simple Moving Average (DMA), now at 1.3771 is limiting the upside attempts in the major.
Meanwhile, the Relative Strength Index (RSI) is turning south towards the midline, backing the latest leg lower.
If the bears extend their control, then a test of the bullish 21-SMA at 1.3738 will be inevitable. Ahead of that cushion, the 1.3750 psychological barrier needs to be cracked by the GBP sellers.
GBP/USD: Four-hour chart
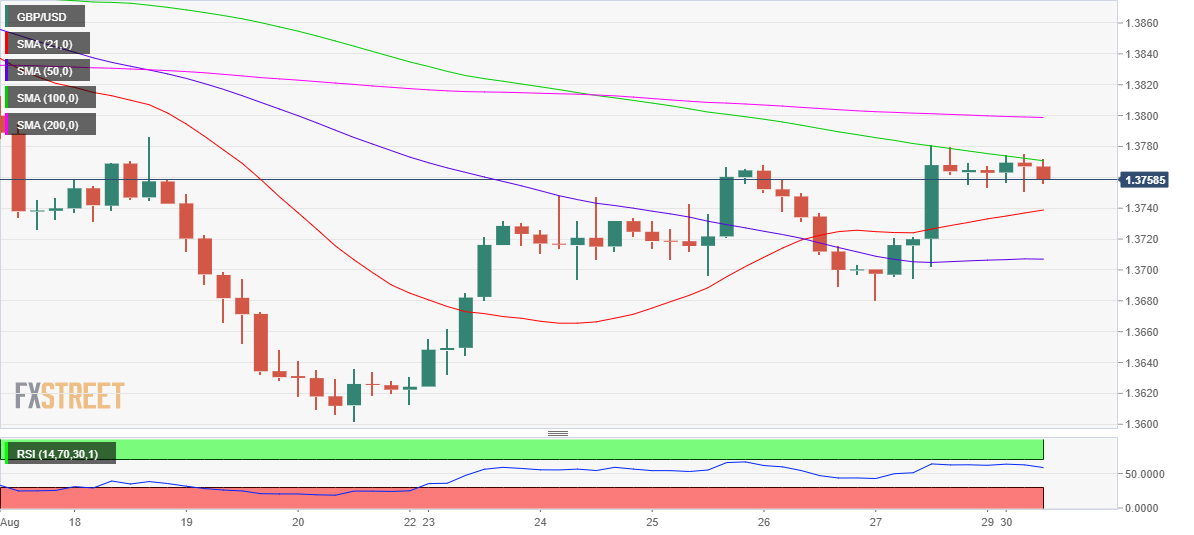
Alternatively, a four-hourly candlestick closing above the 100-SMA resistance could revive the bullish interests, opening doors towards the 1.3800 mark. The horizontal 200-SMA coincides at that level.
Further up, the August 17 highs of 1.3852 could be on the buyers’ radar.


