
- Algorand price is trapped within a continuation pattern as the token continues to confuse forecasts.
- ALGO could be headed for a 35% ascent toward $2.17 if it breaks above $1.62.
- However, slicing below $1.45 could spell trouble for the bulls.
Algorand price is locked within a consolidation pattern as ALGO fails to show signs of directional intentions. The altcoin confuses forecasts as the token registers lower highs and higher lows. A decisive break above or below the prevailing chart pattern could signal a 35% move.
Algorand price at crossroads
Algorand price is sealed within a symmetrical triangle pattern on the 4-hour chart and is likely to move within clearly defined technical levels. The upper boundary of the governing technical pattern is acting as stiff resistance for the token, while the lower boundary of the triangle provides reliable support.
If the bulls decide to take control, Algorand price will face immediate resistance at the 21 four-hour Simple Moving Average (SMA) at $1.55, then at the 38.2% Fibonacci retracement level at $1.59.
The toughest hurdle for Algorand price will emerge at the topside trend line of the prevailing chart pattern at $1.62, which intersects with the 50 four-hour SMA. A slice above this resistance level could put a 35% upswing on the radar toward $2.17.
Following hurdles will emerge at the 50% retracement level at $1.68, then at the 100 four-hour SMA at $1.70. A spike in buy orders may see Algorand price tag the 61.8% Fibonacci retracement level at $1.76, then at the 200 four-hour SMA at $1.78.
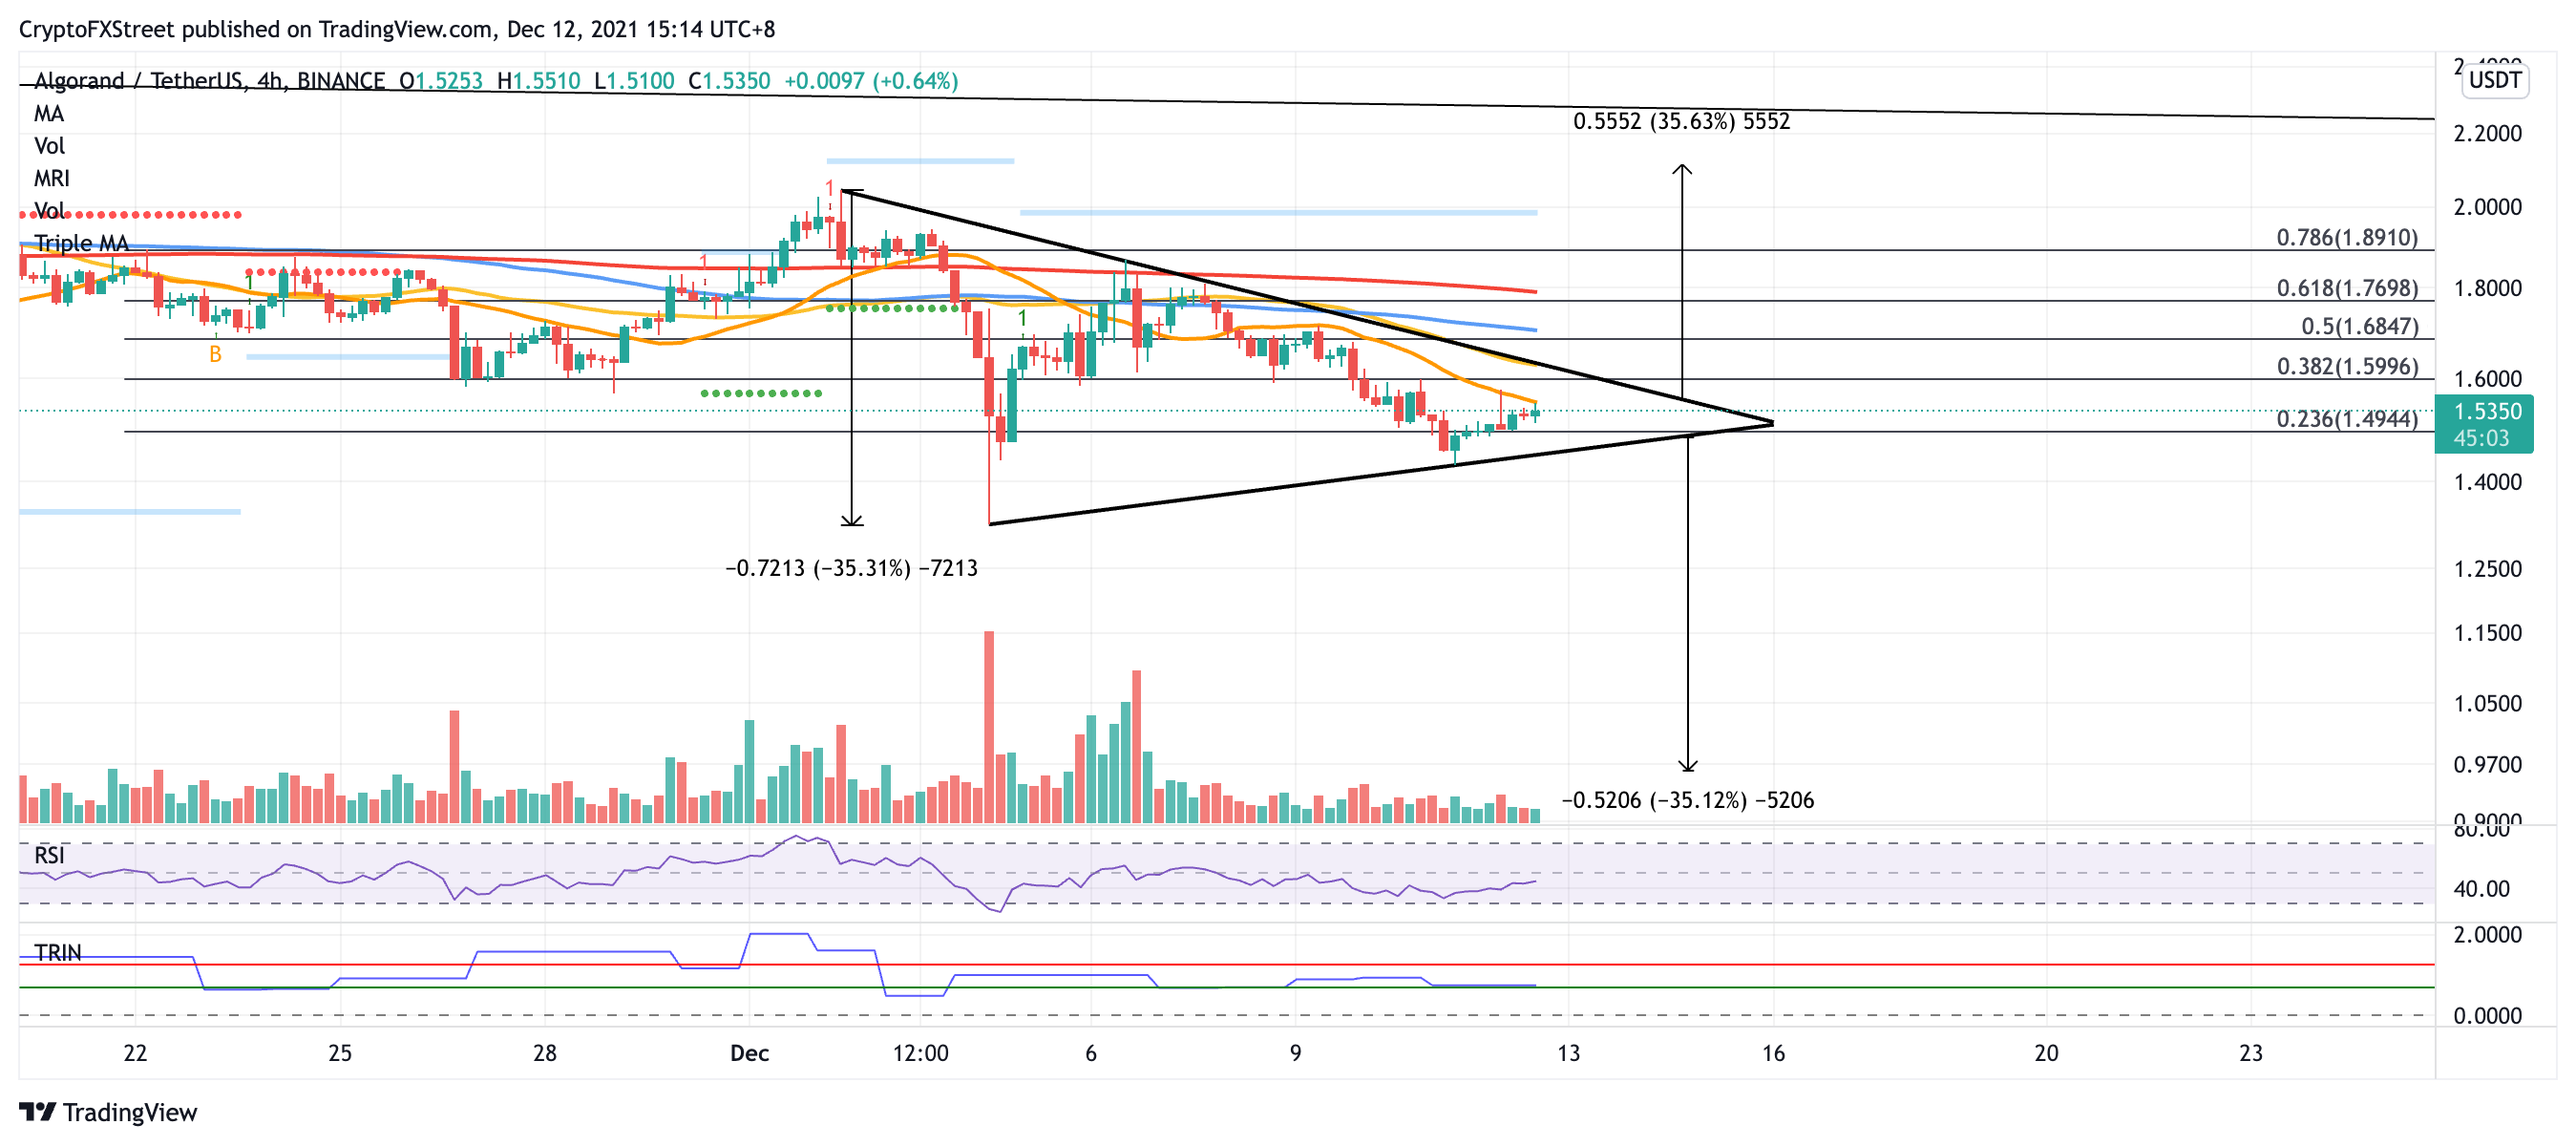
ALGO/USDT 4-hour chart
In order for ALGO bulls to reach the bullish target, Algorand must also overcome the 78.6% Fibonacci retracement level at $1.89, then at the December 2 high at $2.04.
However, if a spike in selling pressure occurs, Algorand price may first test the 23.6% Fibonacci retracement level at $1.49 as support. An additional foothold will emerge at the lower boundary of the triangle at $1.45. Investors should note that falling below this line of defense may put a pessimistic forecast of a 35% plunge on the radar, targeting $0.96, a low not seen since August 27.


