- AUD/USD bears are lurking as the price stalls in its correction.
- All eyes on the US dollar's trajectory as AUD/USD 61.8% Fibo is eyed.
The price of AUD/USD has moved in on a resistance area as measure by the Fibonacci retracements aligning with prior support.
The following illustrates the market structure from a weekly and daily perspective.
Weekly chart
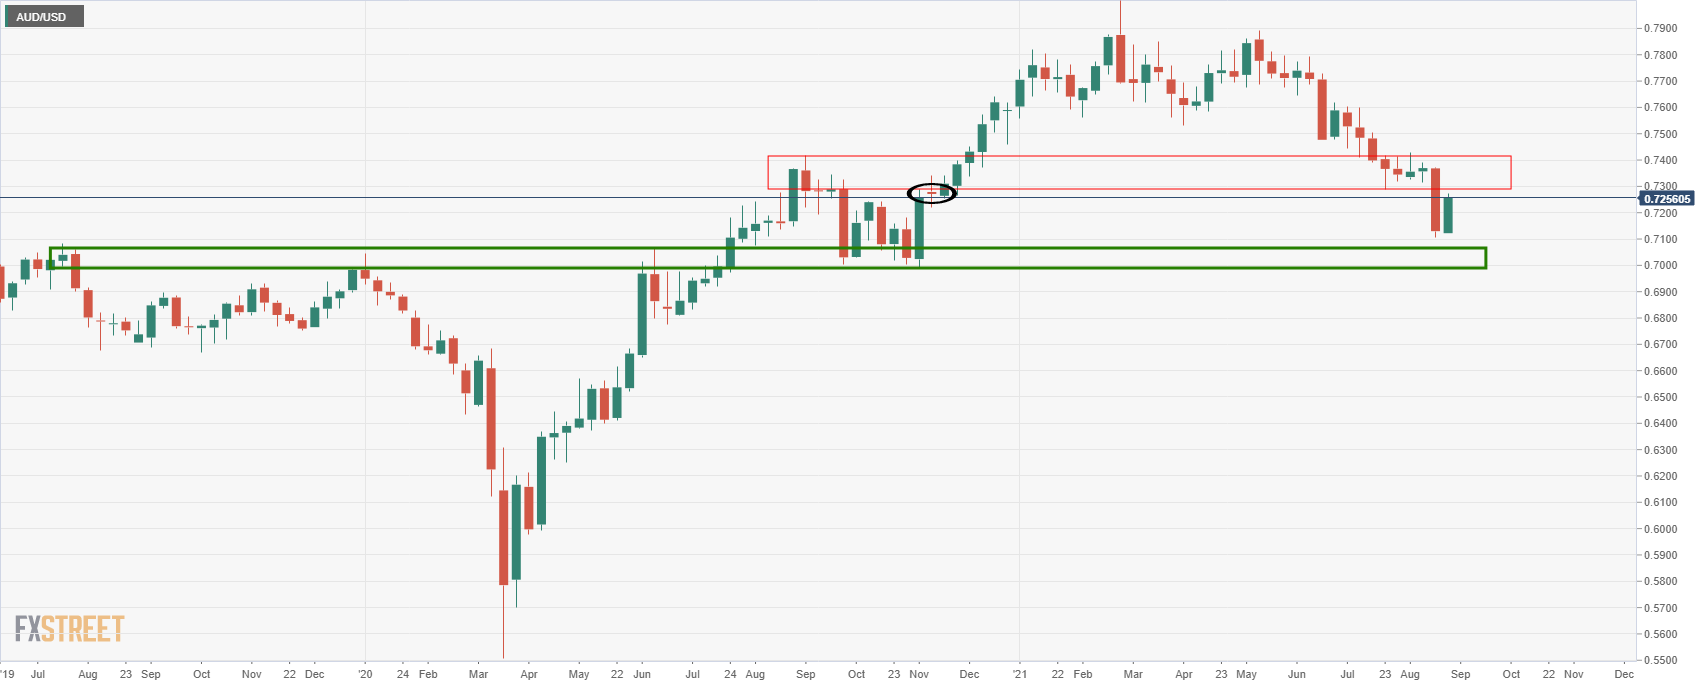
The price is attempting to correct within a weekly bearish trend and it has done so with vigor so far this week.
However, as we draw closer to Friday's Jackson Hole and Aussie Retail Sales, there could be some consolidation on the cards.
Daily chart
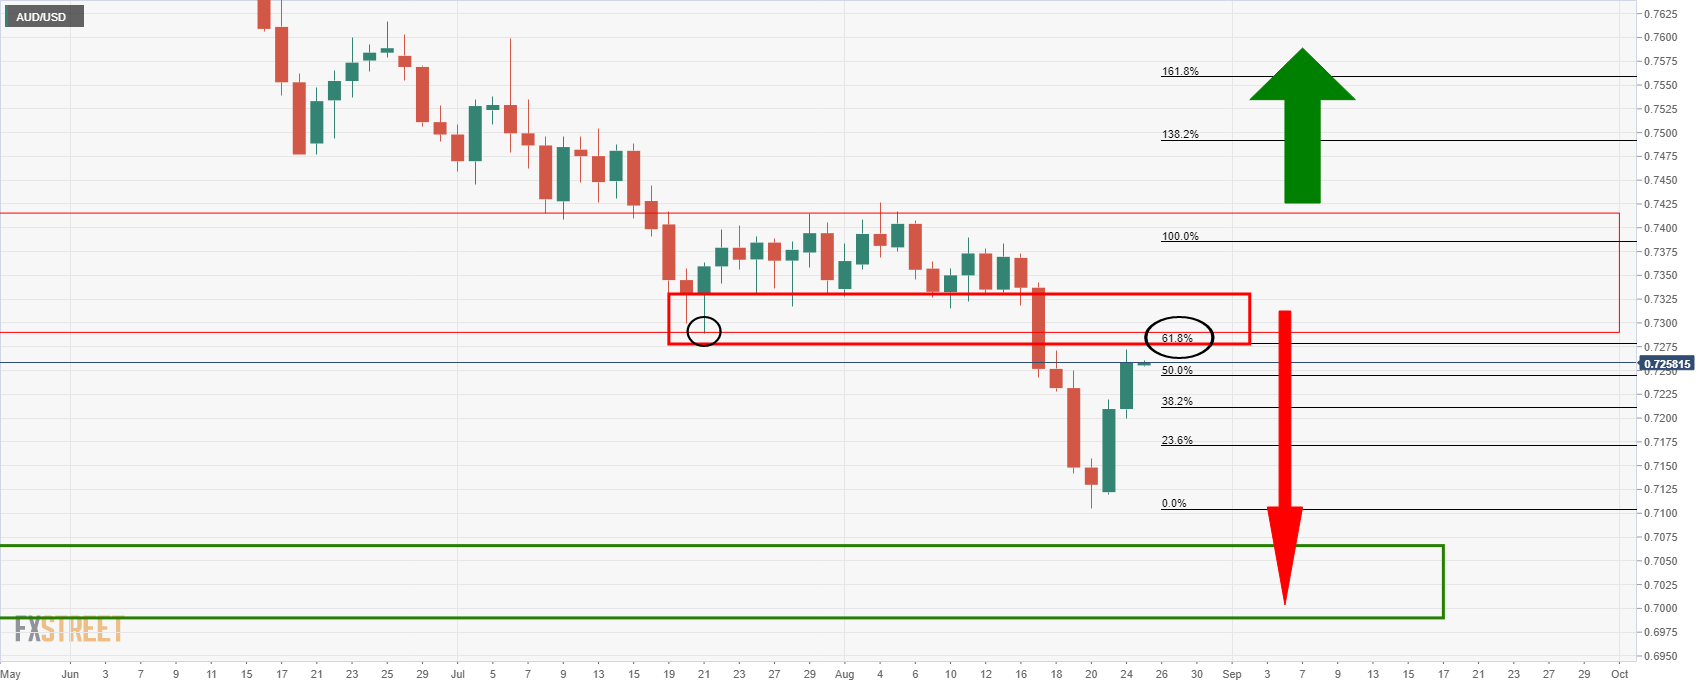
On the daily chart, the price is moving on on old support at 0.7289 and a near confluence of the 61.8% Fibonacci retracement level.
The correction could start to decelerate at this juncture.
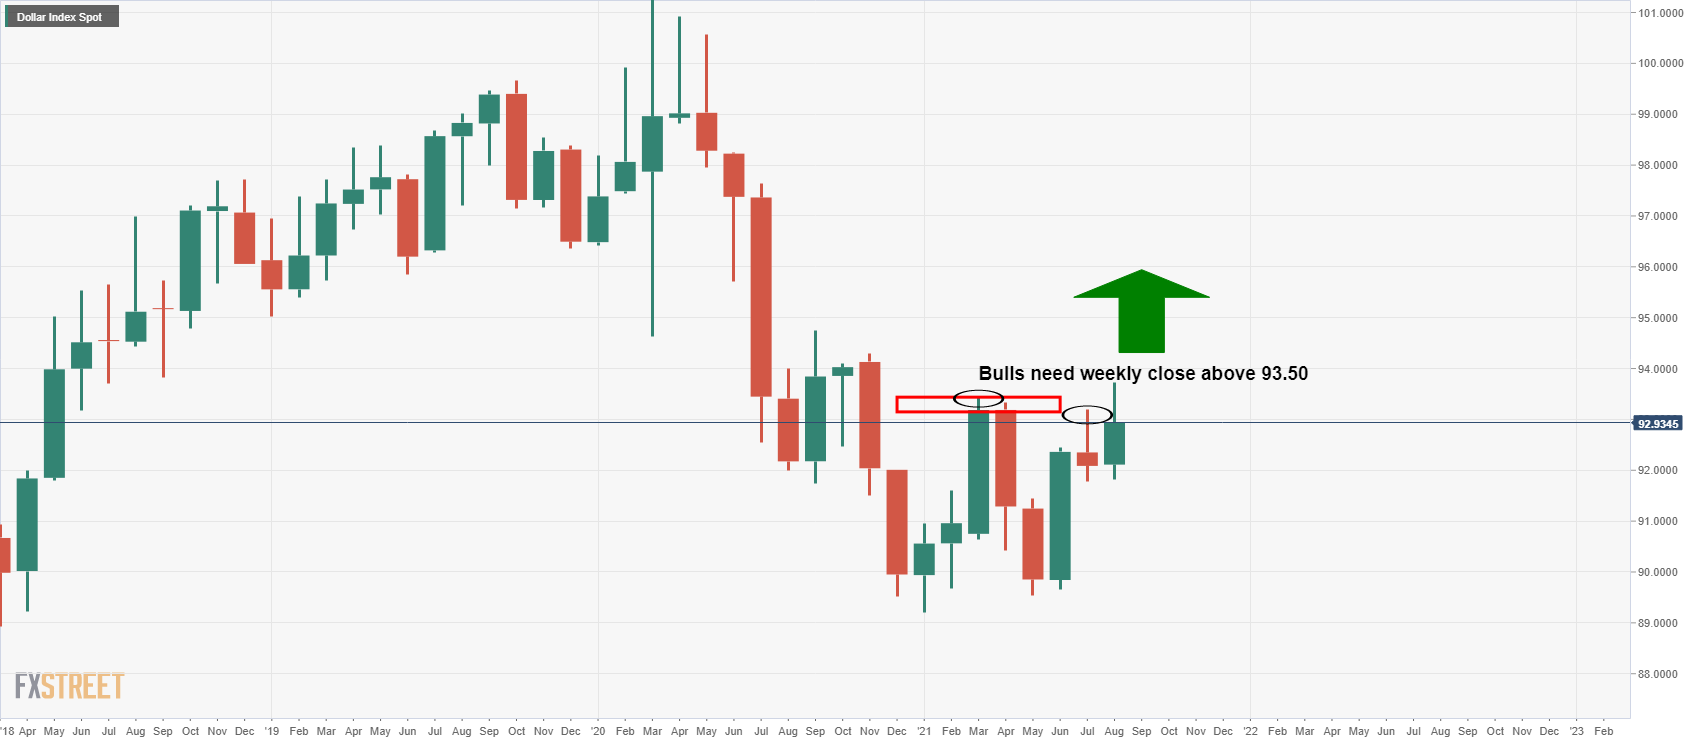
DXY analysis
Should the greenback find traction again, then the downside potential into the weekly structure will be on the cards for AUD/USD.
More on the US dollar's trajectory, here:
US dollar at make or break point, countdown to taper