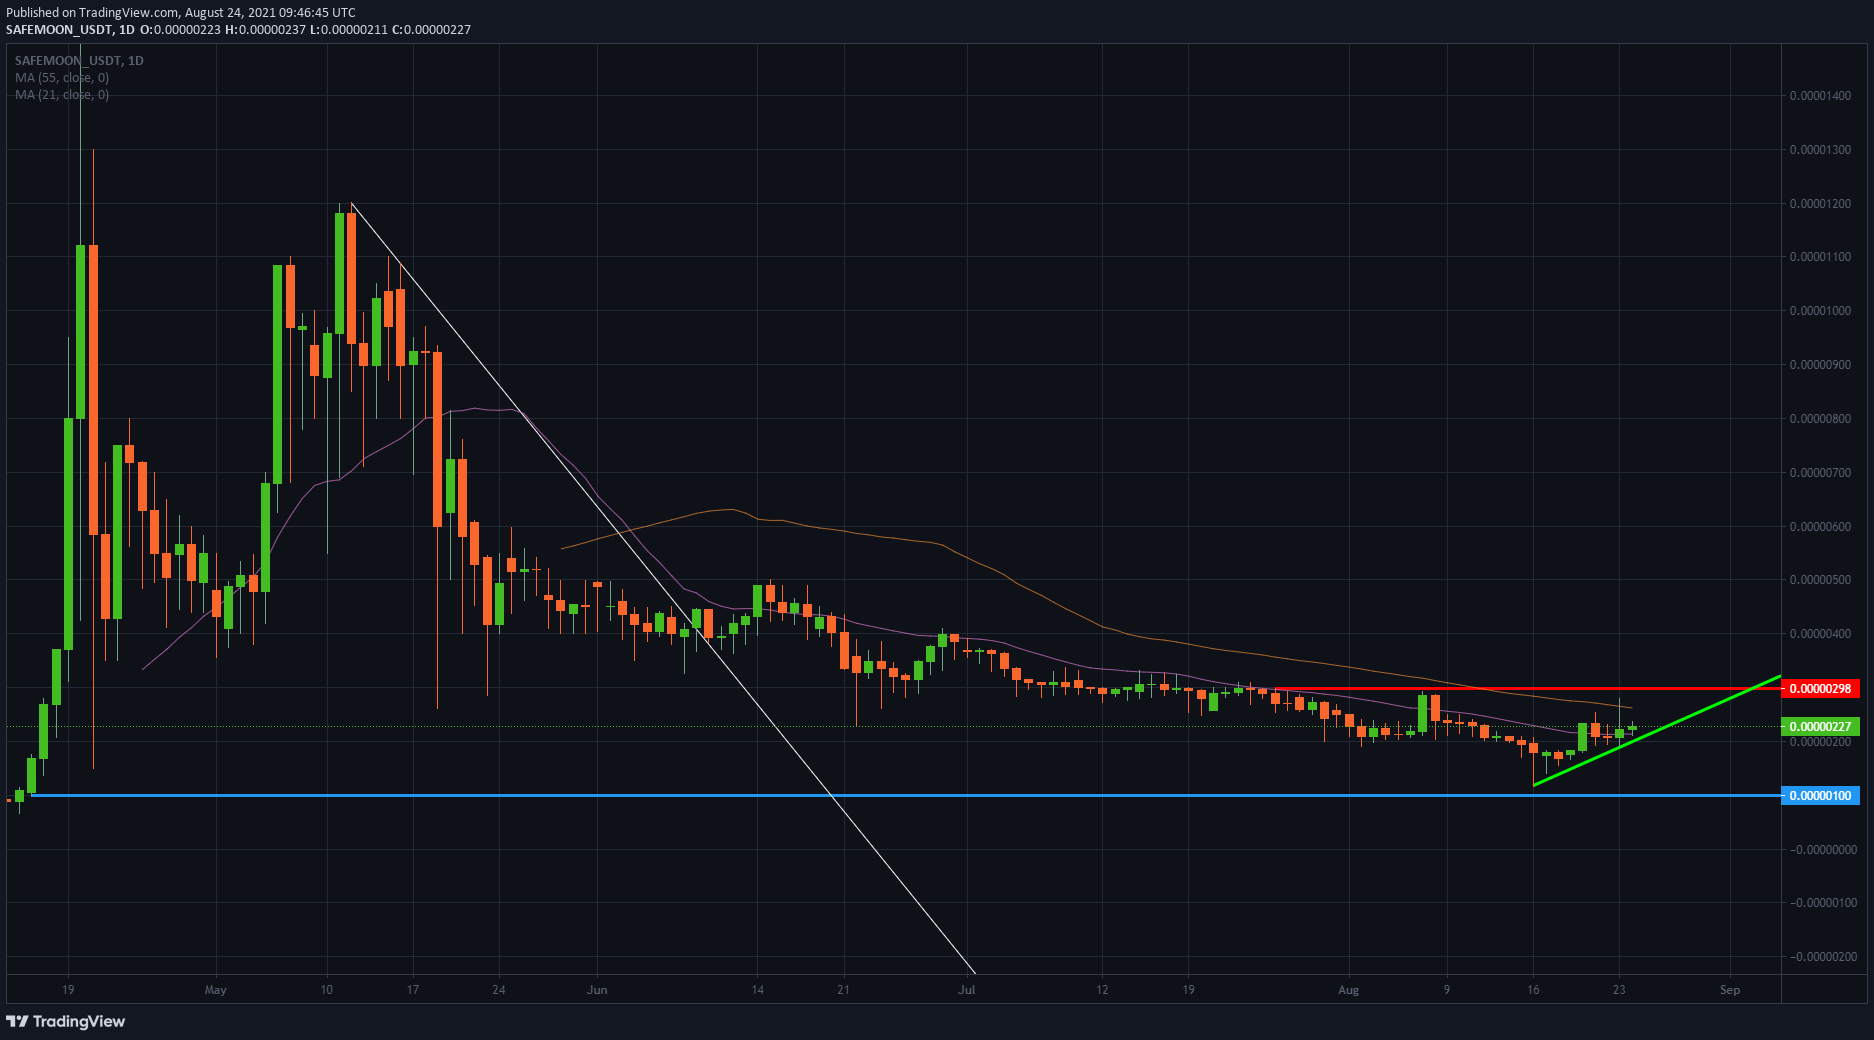
- SafeMoon is in a technical triangle play to the upside.
- $0.00000300 is forming a triple top and will be hard to break above.
- Favorable tailwinds in cryptocurrencies should help SAFEMOON.
SafeMoon price (SAFEMOON) has been on a very subdued recovery path as the more significant cryptocurrencies could recover much more ground to the upside this week. The trend seems to have kicked into high gear since August 16 when SafeMoon almost touched $0.00000100 to the downside.
Price action was able to find some buyers, and SAFEMOON is since then in a triangle play upwards with the green ascending trend line being used as a backbone for the rally. In the meantime, SafeMoon was able to recover and take out the 21-day Simple Moving Average (SMA). That same SMA is today acting as support for the price action and the green ascending trend line and is keeping SafeMoon in rally mode.
SafeMoon has 35% upside potential if it can keep this rally going
The next part to face will be the resistance of the 55-day SMA. That has been a difficult one to break to the upside as it was attempted on August 23. Although the price shot above the 55-day SMA, buyers could not keep the candle above it. It makes the level a difficult one to cross. For now, that level is around $0.00000260 and isa critical level to watch.
Of course, the big target to the upside is $0.00000300, which was formed on July 26. As of that day, SafeMoon was not able to trade above that price. An attempt was made on July 27 and August 7, but both attempts failed and made the price run lower. This level has considerable importance for short-sellers who entered there and have their stops safely tucked above $0.00000300.

SafeMoon/USD daily chart
Expect a big battle between buyers and sellers by the end of this week toward $0.00000300. With the favorable tailwind in the cryptocurrency markets and renewed attention in the media for Bitcoin, SafeMoon should monetize on that attention. Price action will shoot through $0.00000300 to take out most of the stops from short sellers, but once that has happened, expect possible price action to either return to test $0.00000300 or even dip below back to the green ascending trend line.
Should the green ascending trend line break, expect a push further down toward $0.00000100 in the coming weeks as sellers will be in control of the price action.


