
- Bitcoin price slows down as it approaches the weekly open at $20,845.
- The upswing is likely to face the 30-day EMA again after six rejections over the past three months.
- Another rejection at 30-day EMA could plummet BTC to sweep the range low at $17,578.
Bitcoin price is consolidating between significant barriers and shows no signs of moving out yet. The ongoing move could likely face rejection resulting in a steep correction that could send BTC to revisit levels last seen almost a month ago.
Bitcoin price at crossroads
Bitcoin price has been hovering inside the $17,578 to $21,707 range since June 21. The July 7 attempt to move out of this consolidation failed after facing rejection at the hands of the 30-day Exponential Moving Average (EMA).
This EMA has prevented the Bitcoin price from moving higher for nearly 100 days and has been consistent in doing so. The latest rejection on July 8 led to a 16% downswing that eventually created a double bottom.
The $18,600 to $19,252 area formed a based on which the W-bottom was created. This formation triggered BTC to rise by 10% to retest the weekly open at $20,845, where it currently faces a hurdle.
As Bitcoin price hovers around $20,647, investors are in limbo trying to guess where it will go next. Based on its three-month history and six rejections, having bullish expectations until BTC flips the 30-day EMA into a support floor is a lost cause.
For now, BTC is likely to continue to chip between the weekly open at $20,845 and the liquidity pool’s base at $18,600.
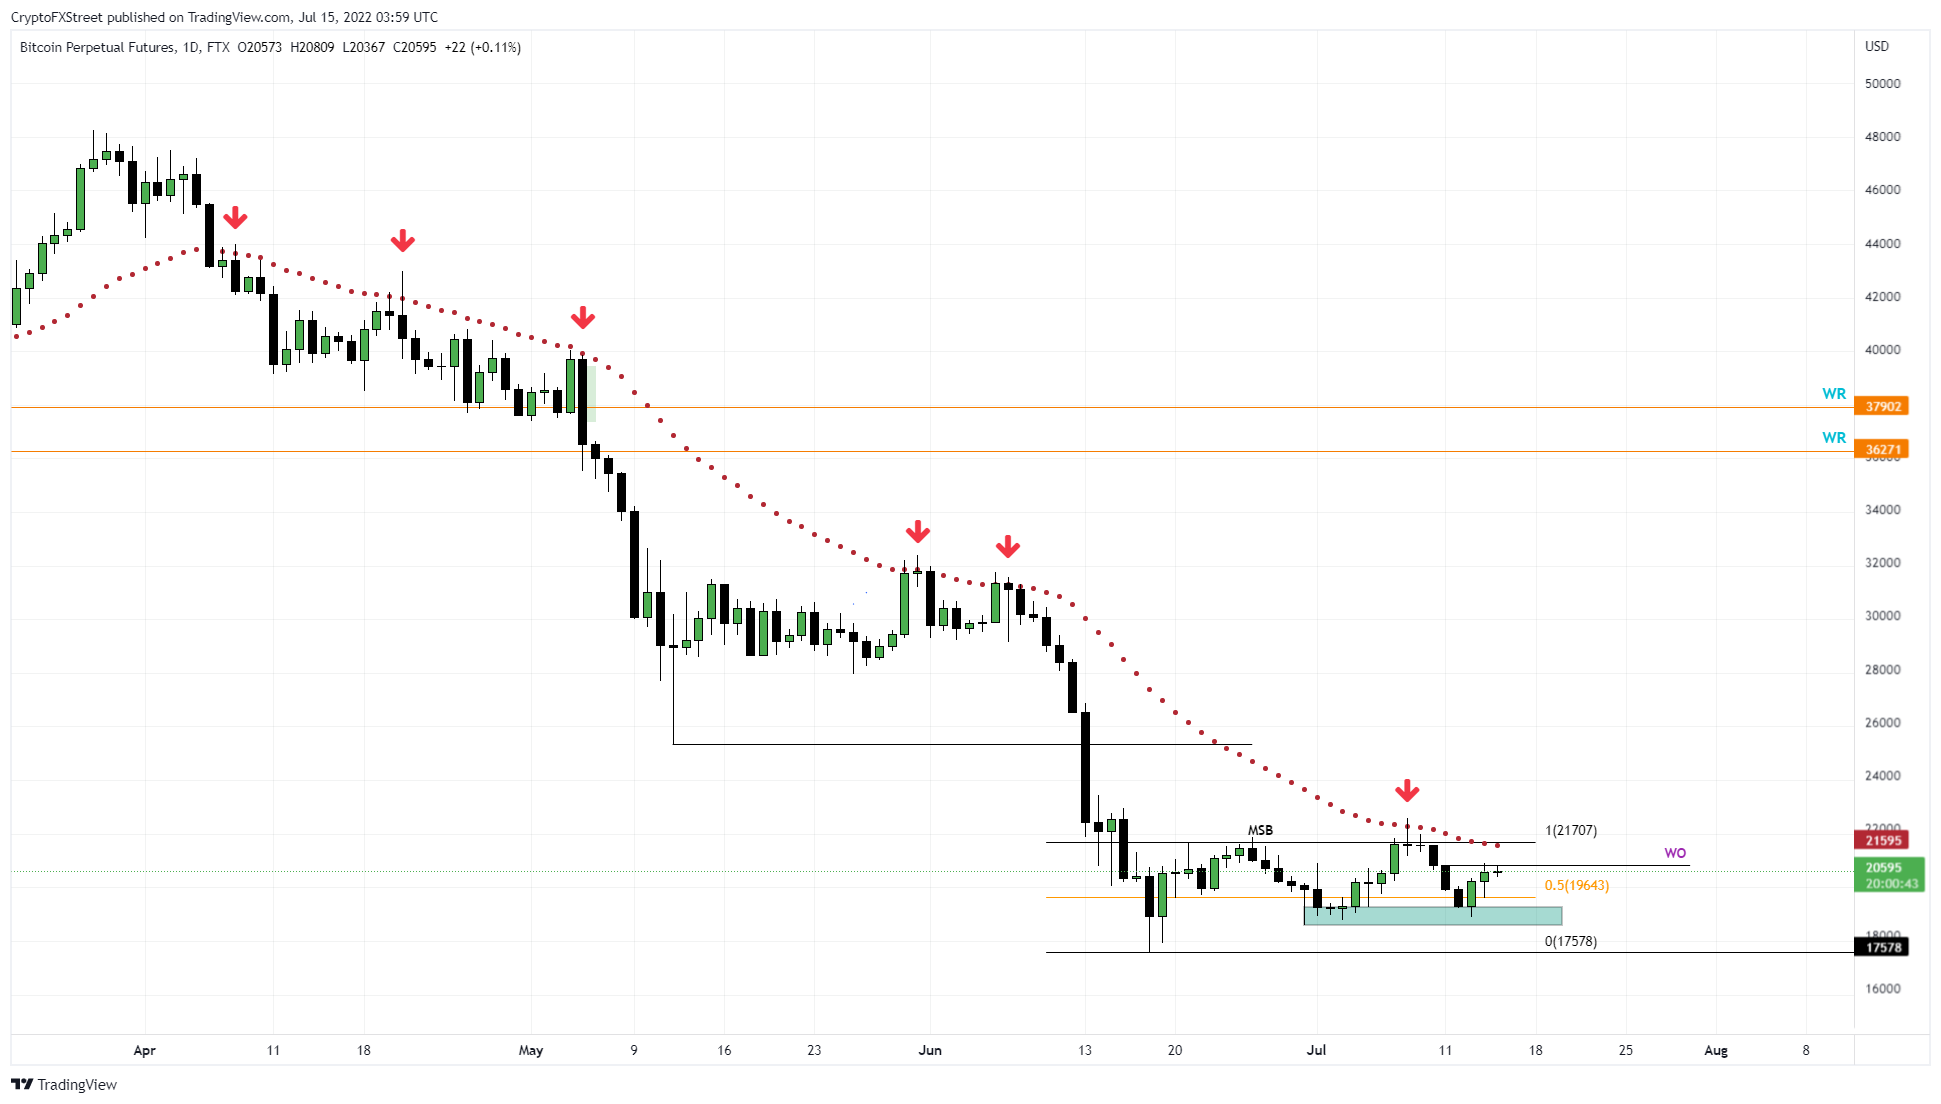
BTC/USDT 1-day chart
The Bullish Take
Assuming the Bitcoin price manages to flip the 30-day EMA at $21,596, it will open the possibility of a 13% gain. However, even this bullish outlook has one contingency, which is a successful flip of the 200-week Simple Moving Average (SMA) at $22,569.
If buyers manage to overcome these tall orders, then investors can expect the Bitcoin price to return to the mean at $24,657. This level is the midpoint of the 44% crash that pushed Bitcoin price from $31,737 to $17,578 due to the Terra-LUNA debacle.
In some cases, Bitcoin price could revisit the May 12 swing low at $25,401.
The Bearish Take
from a historical perspective, the 200-week SMA has been a significant one. Since the Bitcoin price flipped this support level into a resistance barrier, it suggests that the sellers are in control. Moreover, the recent retest led to a rejection, further adding credence to the bearish fact.
Therefore, even if BTC manages to slice through the 30-day EMA, overcoming the 200-week SMA during a time when there are clear threats of recession is highly unlikely. The Consumer Price Index (CPI) hitting 9.1% is just an added confirmation that the global economy is just a nudge away from crumbling
Therefore, the likely outcome for Bitcoin price would be a dip into the $18,600 to $19,252 liquidity pool followed by a sweep of the range low at $17,592.
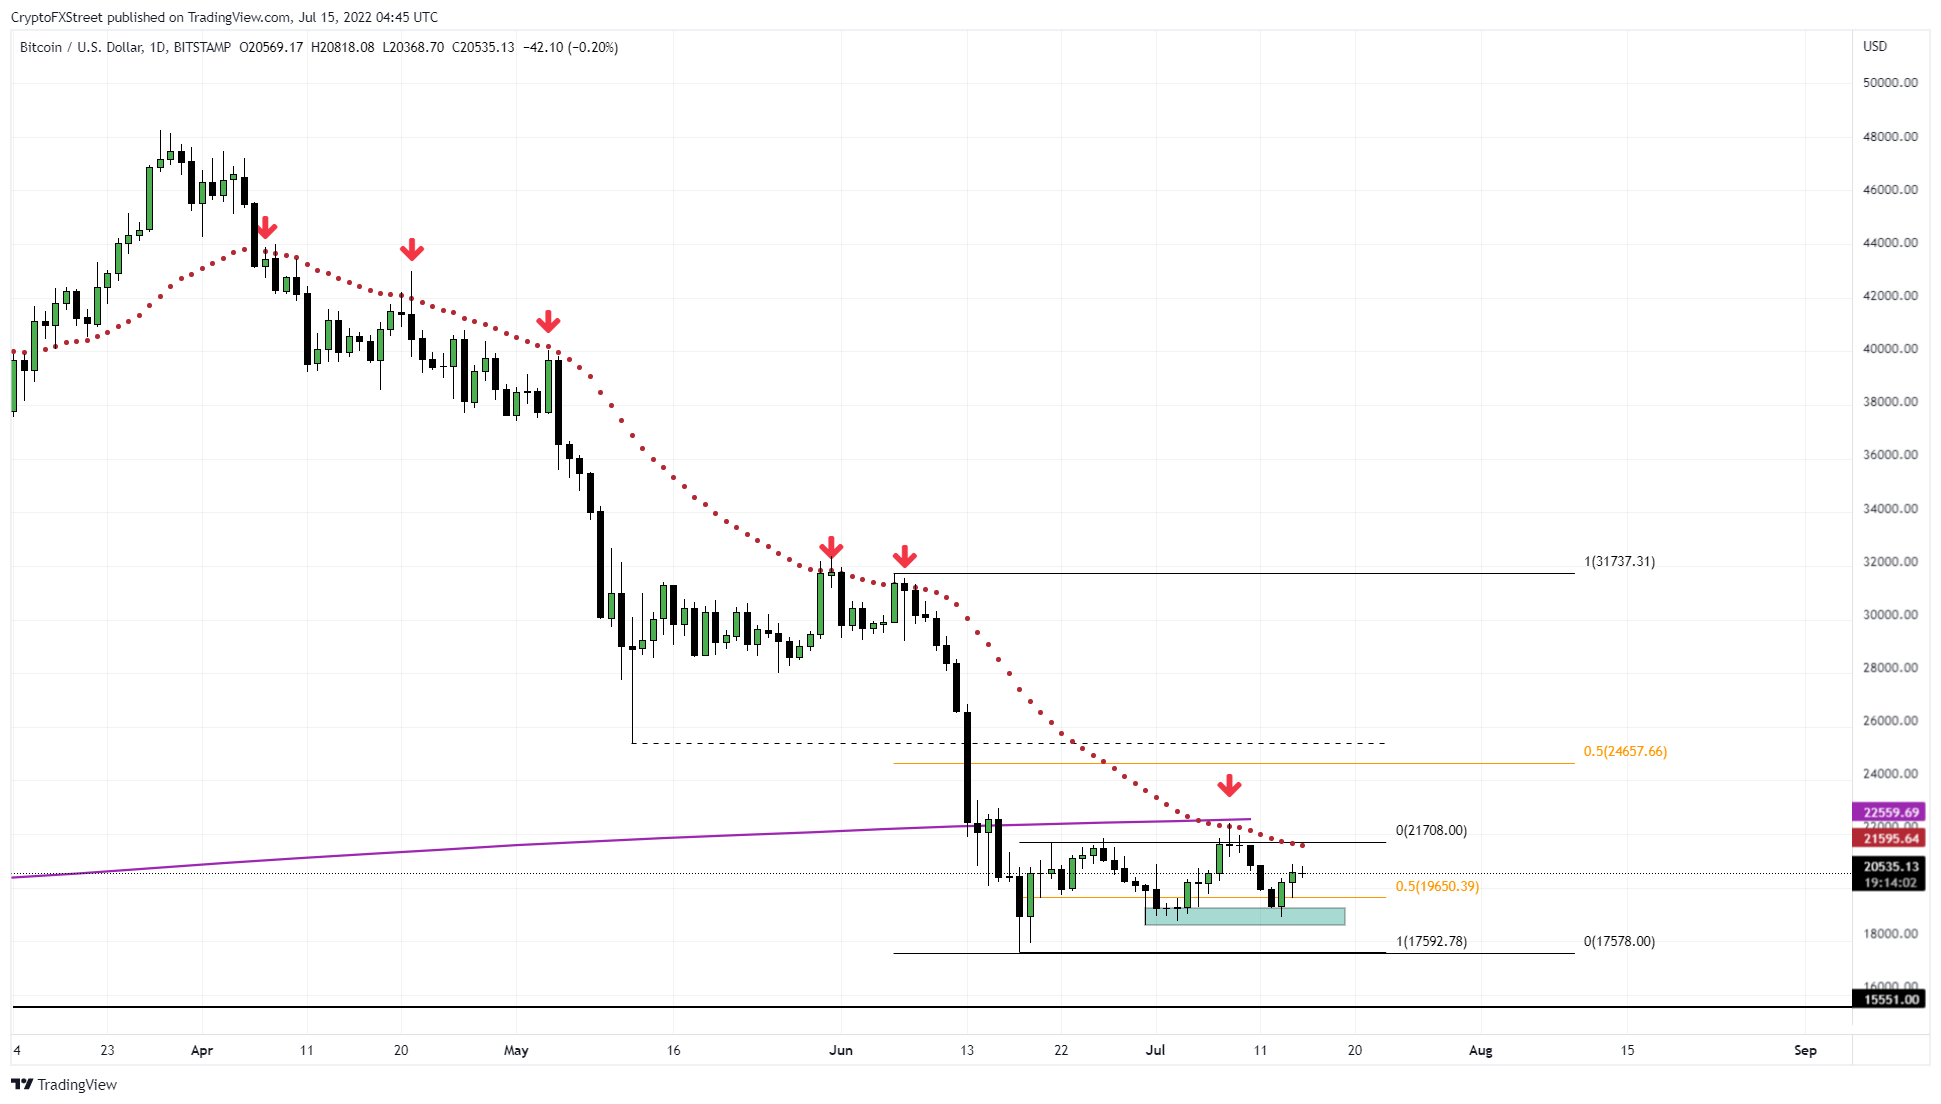
BTC/USDT 1-day chart
Concluding thoughts
If one were to select a side, the possibility of a further descent in Bitcoin price is more plausible and likely than BTC’s second attempt to overcome the 200-week SMA at $22,559. Rejection at the weekly open at $20,845 followed by a sweep of the range low at $17,578 would suggest that the rangebound movements are in play.
However, investors should note that a daily candlestick close below $17,578 would signal that bears have a much larger plan. In such a case, the Bitcoin price could slide lower and revisit the $15,551 support level.


