
- Chainlink price tested the May 23 low, but the rebound has lacked energetic commitment from investors.
- Bearish Death Cross pattern to trigger in a matter of days as the 50-day simple moving average (SMA) converges with 200-day SMA.
- LINK failed to register an oversold reading on the daily Relative Strength Index (RSI), despite a 70% decline.
Chainlink price successfully holds the May 23 low but does not register an oversold reading or generate substantive investor interest, thereby raising some doubt about the end of the correction. LINK faces notable overhead resistance moving forward, lending some credibility to the cautious outlook in this post.
Chainlink price is trend-free, lacking relative strength at the moment
Chainlink price declined just over 70% from the May 10 high of $52.99 to the May 23 low of $15.00, placing it around the average for cryptocurrency corrections. The most recent sell-off tested the May 23 low after failing to hold the 50-week SMA last week. LINK appeared ready to test the weekly Ichimoku Cloud for the first time since March 2020, before rebounding off the June 22 low.
The outlook for Chainlink price is mixed due to a lack of relative strength, the noncommittal volume profile and the burdensome declining trendline from the May 10 high. Yes, LINK does maintain a level of support that can be traded against, but it is far from convincing.
To alter the skeptical outlook, Chainlink price needs a daily close above the union of the May 10 declining trend line with the June 12 low of $20.02. Nevertheless, LINK confronts a bearish Death Cross in the next couple of days, exerting some pressure on the digital asset even if it attracts bids over the trend line.
If Chainlink price does build interest among cryptocurrency investors, LINK does have an open path to test the confluence of the June 15 high of $26.46 with the 200-day SMA at $26.92, offering a 35% return from the May declining trendline. Further price strength will discover resistance at the 38.2% Fibonacci retracement of the May correction at $29.51, as well as the daily Ichimoku Cloud.
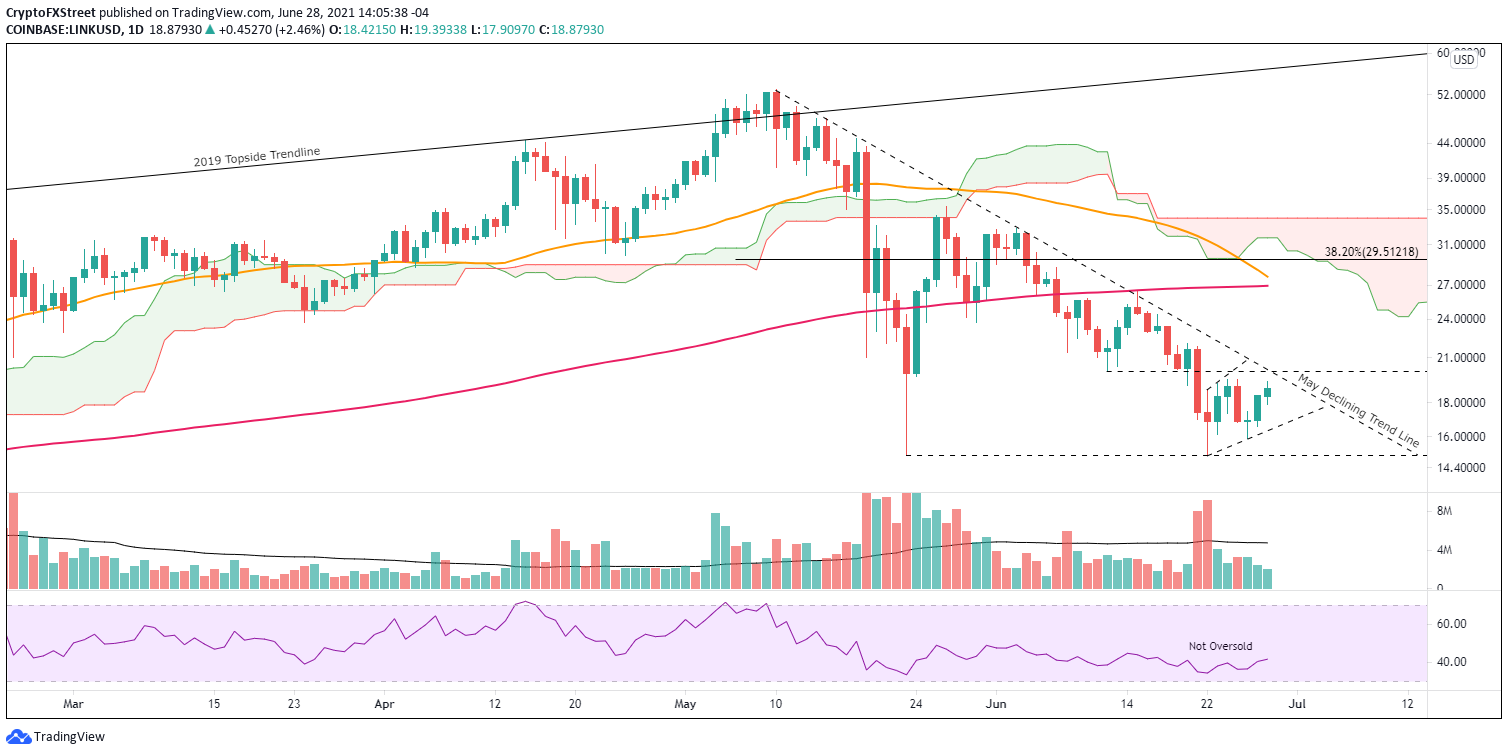
LINK/USD daily chart
For now, the bounce from the June 22 low resembles corrective Chainlink price action and not the impulsive thrust that is characteristic of firm lows. Moreover, the underlying volume profile does not show one positive day on above-average volume.
A decline below the minor trend line from the June 22 low at $16.52 will raise the probability that Chainlink price will sweep the May 23 low of $15.00 and possibly test the weekly Ichimoku Cloud support currently at $14.20.
Contrastingly, the on-chain metric, LINK 365-day MVRV ratio, shows the cryptocurrency as undervalued as in March 2020, and it is confirmed by the 30-day SMA, also in negative territory.
Generally, the higher the MVRV ratio, the greater the unclaimed profits, thus the higher risk that LINK holders will begin to sell and lower their exposure. This is why it is believed that extremely high MVRV ratios indicate overvalued conditions, while very low MVRV ratios may offer a timely opportunity to accumulate.
Thus, based on the 365-day MVRV ratio, Chainlink price is in a timely rebound zone and suggests that investors consider accumulating LINK.
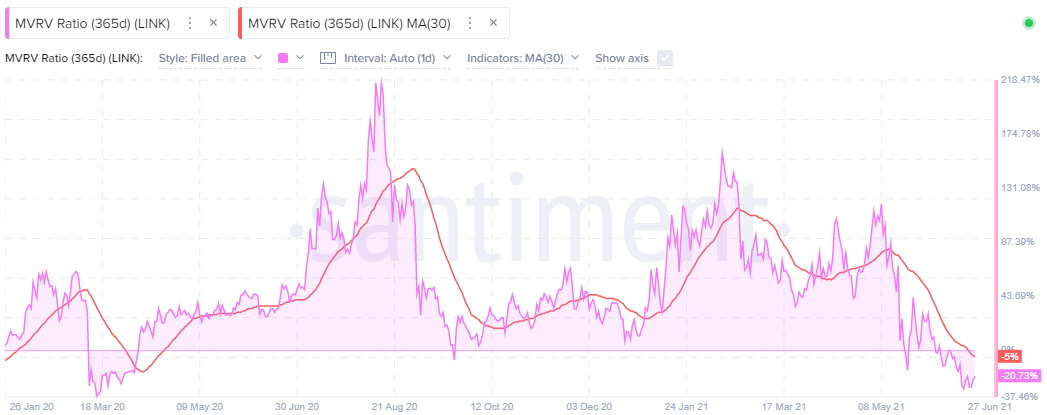
LINK 365-day MVRV ratio – Santiment
Chainlink price bottoms are never clear using technical criteria, and the same can be said for LINK on-chain metrics. The charts argue against a heavy bullish stance, but MVRV advises LINK investors to be flexible due to the undervalued conditions. As a result, investing is a balancing act, stacking probabilities in favor of one forecast or another. At this point, the information reveals a divergence and advocates a Chainlink price outlook that is neutral with a slight bearish tilt.


