
- Bitcoin price may have marked a correction low with a bullish weekly hammer pattern.
- Ethereum price successfully tests 2020 trend line and rebounds to close in the upper half of the weekly range.
- XRP price negotiates a robust rebound from the confluence of the 50-week simple moving average (SMA) with a key Fibonacci level.
Bitcoin price recovers anchored VWAP for the third week out of the last six, reinforcing the importance of the indicator in guiding BTC during the corrective process. Ethereum price rebound has been insignificant, suggesting disinterest in the smart contracts giant. XRP price discovers strong support, but intimidating support and resistance level may keep the international settlements token range-bound.
Bitcoin price changes its tune after weeks of volatility
Bitcoin price logged a notable return yesterday, as it gained over 7%, taking the flagship cryptocurrency back to the symmetrical triangle’s upper trend line. Since the June 22 low, the rebound has been indecisive and lacking a punch of volatility characteristic of formative lows. Nevertheless, the quick BTC rebound from around the May low communicates the presence and interest of prominent investors, including institutions, to use the risk level to accumulate positions. Undoubtedly, retail investors participated, but it is large investors that can ignite noteworthy rebounds.
It is no surprise that Bitcoin price does retest the May 19 low of $30,000 because round numbers tend to possess a magnet effect on the price, as noted in the work of Monroe Trout. However, each successful test establishes a better foundation to absorb negative news, such as the decision by the U.K. regulator, Financial Conduct Authority, to ban Binance from operating in the U.K on the weekend.
The result of last week’s oscillations is a powerful bullish weekly hammer candlestick that closed above the 50-week simple moving average (SMA) at $30,452 and the anchored VWAP from July 2020 at $33,422. Consequently, Bitcoin price has set the platform for a renewed rally to the fierce resistance at $41,500-$43,500 that includes the 38.2% Fibonacci retracement of the April-June correction at $42,589.
To be specific, a daily close above last week’s high of $35,741 will trigger the hammer candlestick pattern and provide the first signal for BTC investors to entertain new positions or add to existing positions. Some resistance will materialize at the 50-day SMA at $38,624, but Bitcoin price should overcome the moving average and steadily rise to the previously mentioned resistance between $41,500-$43,500, delivering a 20% return.
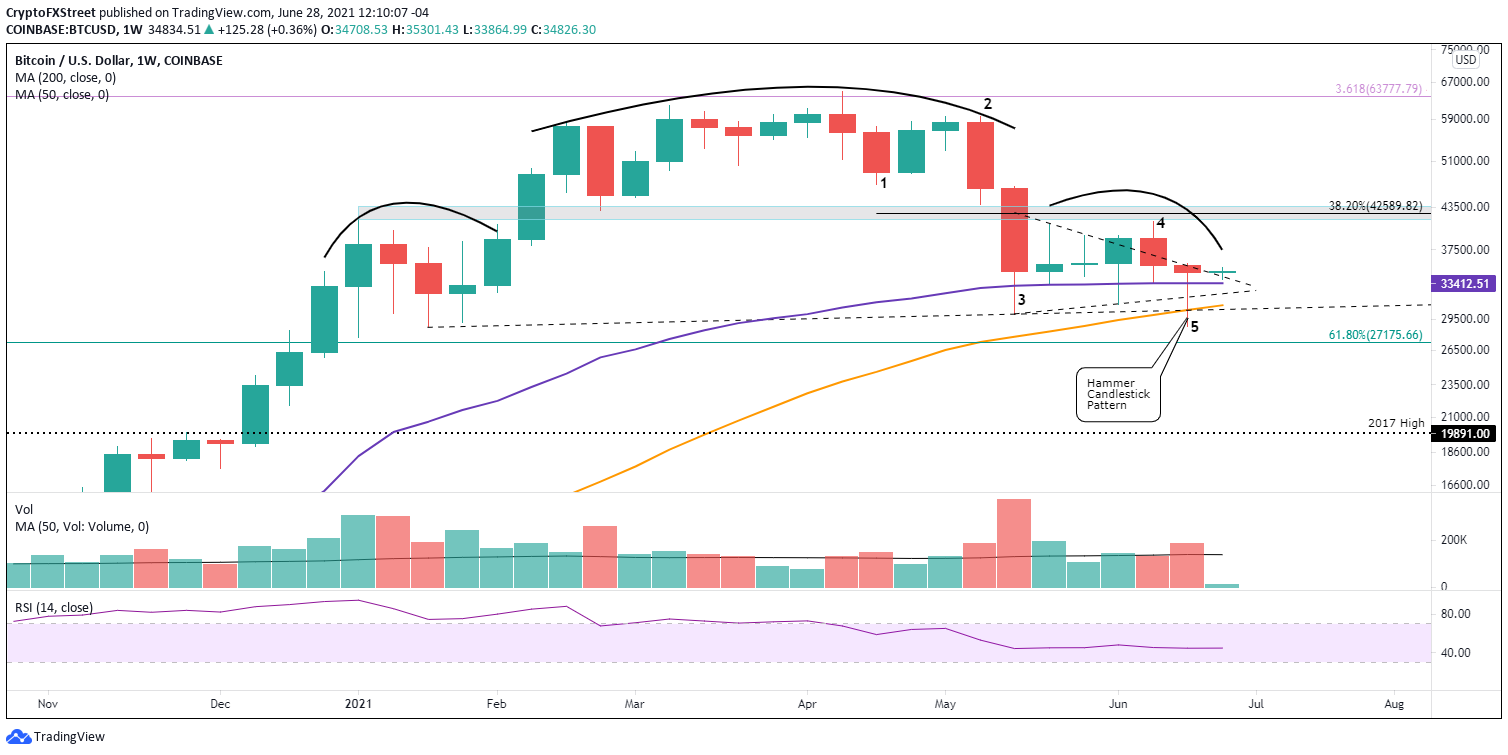
BTC/USD weekly chart
From a bigger picture, Bitcoin price did trigger the neckline of a head-and-shoulders topping pattern on June 22. The pattern remains active until BTC trades above the right shoulder high of $41,332, thus improving the probabilities that last week’s low was the correction low. Moreover, the digital asset did trigger a bearish Death Cross pattern on June 19 when the 50-day SMA crossed below the 200-day SMA.
Both bearish developments need to be present in formulating and executing BTC trading programs.
Overall, Bitcoin price has afforded the bullish speculator a weekly hammer candlestick pattern, a bullish momentum divergence on the daily Relative Strength Index and a complete Elliot five wave down pattern. Combined with the support of key price levels, BTC is primed for better outcomes moving forward.
Ethereum price trend unclear, but maybe there hides an opportunity
The positive response of Ethereum price to the outstanding support framed by the 200-day SMA at $1,878, the 2020 rising trend line at $1,793, the 61.8% retracement of the March 2020-May 2021 advance at $1,730 and the May 23 low of $1,728 created a hint of optimism for enthusiastic ETH investors and short term speculators on June 22.
However, Ethereum price action since June 22 has not been compelling or comparable to some of the rebounds in other altcoins, suggesting ETH is grappling with depleted interest even on a day-to-day basis. It makes attempts to overcome the February high at $2,041 on a daily closing basis a remote possibility. Confounding the outlook is a volume profile that only speaks to distribution, not accumulation.
A daily close above the February high of $2,041, which may be today, is the first step to getting ETH standing on both feet, but Ethereum price will still be tasked with the heavy resistance of the 50% retracement of the advance from the March 2020 low to May 2021 high at $2,237.
Additional upside targets for Ethereum price include the 50-day SMA at $2,675, the apex of the symmetrical triangle at $2,730 and the Ichimoku Cloud, creating a trifecta of resistance.
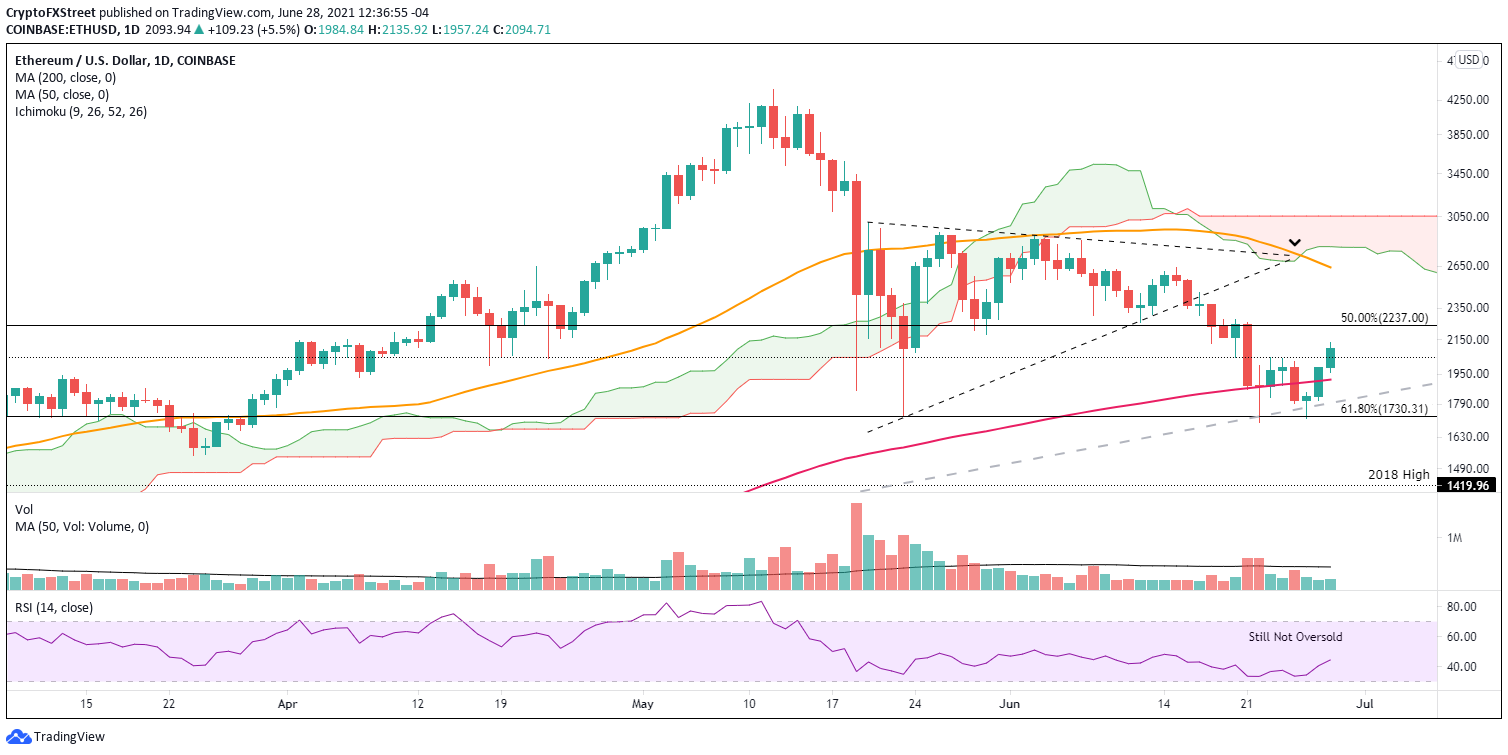
ETH/USD daily chart
If Ethereum price logs a daily close below the 2020 trend line at $1,798 and the 61.8% retracement at $1,730, ETH may explore the support established by the 2018 high at $1,419, yielding a 22% decline from the current price.
There is no other way to say it; Ethereum price has been zombie-like until today, showing no signs of relative strength against Bitcoin or other digital assets, thereby keeping forecasts tilted bearish or at least neutral. Nevertheless, today’s 7% gain at the time of writing might be the catalyst to shake ETH from the doldrums and on the path to higher price levels.
XRP price battleground is clear, but commitment needs to improve
At the June 22 low, XRP price had declined 70% from the April high of $1.96 and a noticeable 50% from the June 1 high while liquidating the May 23 low of $0.652, a level fortified by weekly highs in late 2020 and February 2021. Nonetheless, Ripple realized three important technical milestones that provoked a 35% rebound: a test of the 78.6% retracement of the December 2020-April 2021 advance at $0.555, an undercut of the 50-week SMA at $0.540 and registered an oversold reading on the daily RSI for the first time since late December 2020.
Notably, the XRP price outlook received a jolt of optimism yesterday when Ripple closed the week just below the May low of $0.652 and in the upper half of the weekly trading range. A vast improvement considering that at one point last week, XRP price appeared ready to test the 200-week SMA at $0.449.
A daily close above $0.652 will confirm a solid price low and revolutionize Ripple for a test of the resistance defined by the coupling of the 200-day SMA at $0.728 with the anchored VWAP from December 29, 2020, at $0.740. Moreover, the neckline of a multi-year inverse head-and-shoulders pattern rests at $0.760, establishing an equally significant obstacle.
XRP price will not be free until a daily close above $0.760, and it will be a struggle to accomplish the feat in the context of an insecure cryptocurrency complex. However, if achieved, Ripple can expect a rally to the confluence of the declining 50-day SMA at $0.980 with the psychologically important $1.00.
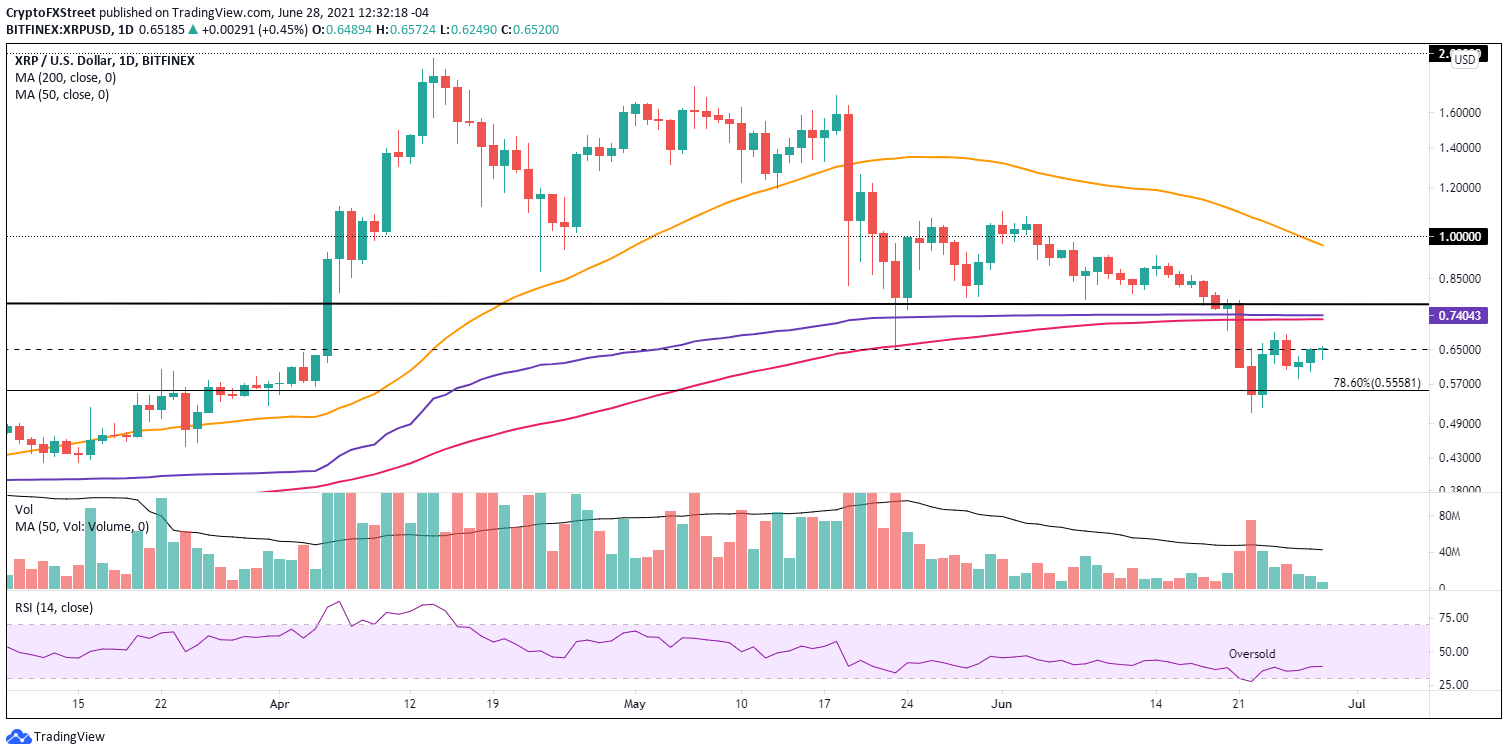
XRP/USD daily chart
On the flip side, a weekly close below the 50-week SMA at $0.550 introduces a new potential outcome for XRP price. It may signal that Ripple will complete a full reversion to the mean and test the 200-week SMA at $0.449. A drop to the mean would equal a 30% decline from the current price.
Moving forward, XRP price may choose to trade between the 50-week SMA at $0.540 and the resistance around $0.740. It would grant ideal trading conditions for swing traders due to the bulking support and resistance levels and the resulting 30% profit opportunities that lie between.


