
- GBP/USD remains pressured for the third consecutive day.
- Sustained trading below 200-DMA, clear downside break of 50-DMA favor sellers as MACD teases bears.
- Four-month-old horizontal area in focus, early October tops probe immediate declines.
GBP/USD stays pressured around a three-week low, flashed the previous day.
That being said, the Cable pair traders near 1.3660 during Tuesday’s Asian session, extending Friday’s downside break of 50-DMA, not to forget the pair’s sustained trading below 200-DMA since September.
Given the MACD line crossing the signal line to portray a bearish impulse, coupled with the aforementioned catalysts concerning the DMAs, the GBP/USD is likely to extend the latest declines.
In doing so, a horizontal area including multiple levels marked since July 20, around 1.3575, gains market attention. However, early October tops near 1.3550-45 allow immediate rest to the GBP/USD bulls.
Should the quote remain bearish past 1.3575, it becomes vulnerable to challenge the yearly low surrounding 1.3410, marked during October.
Meanwhile, the corrective pullback may aim for a 50-DMA level of 1.3712 before the 50% Fibonacci retracement level of June-September south-run around 1.3830.
However, the 200-DMA level of 1.3851 will precede the highs marked during September, close to 1.3915, to test the GBP/USD bulls afterward.
GBP/USD: Daily chart
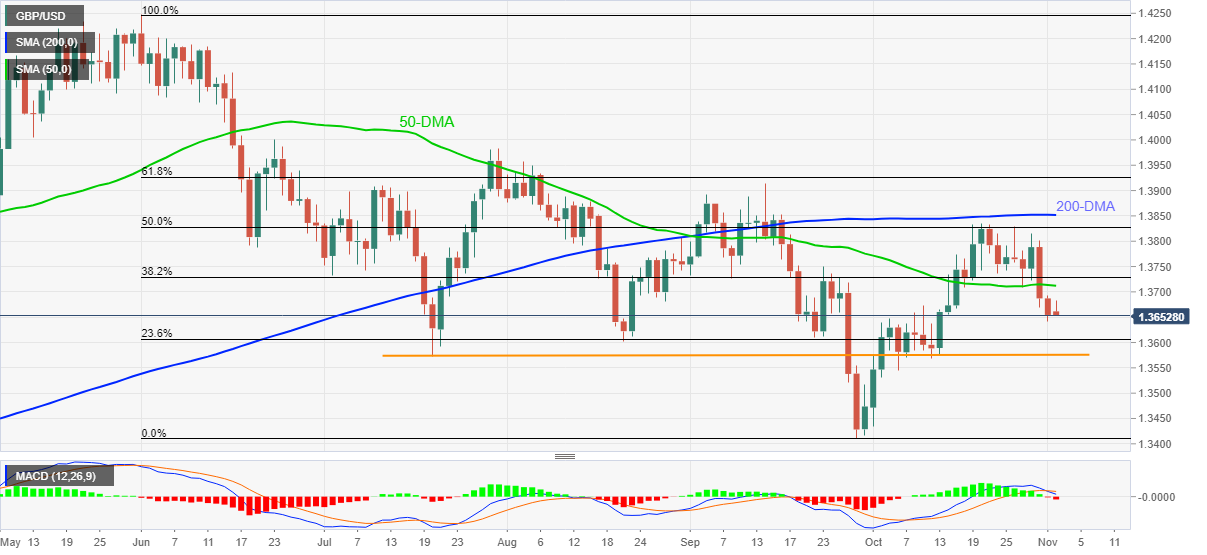
Trend: Further weakness expected


