
- The bulls have stepped in at a critical daily demand area.
- GBP/USD bears are lurking at ket 4-hour resistance.
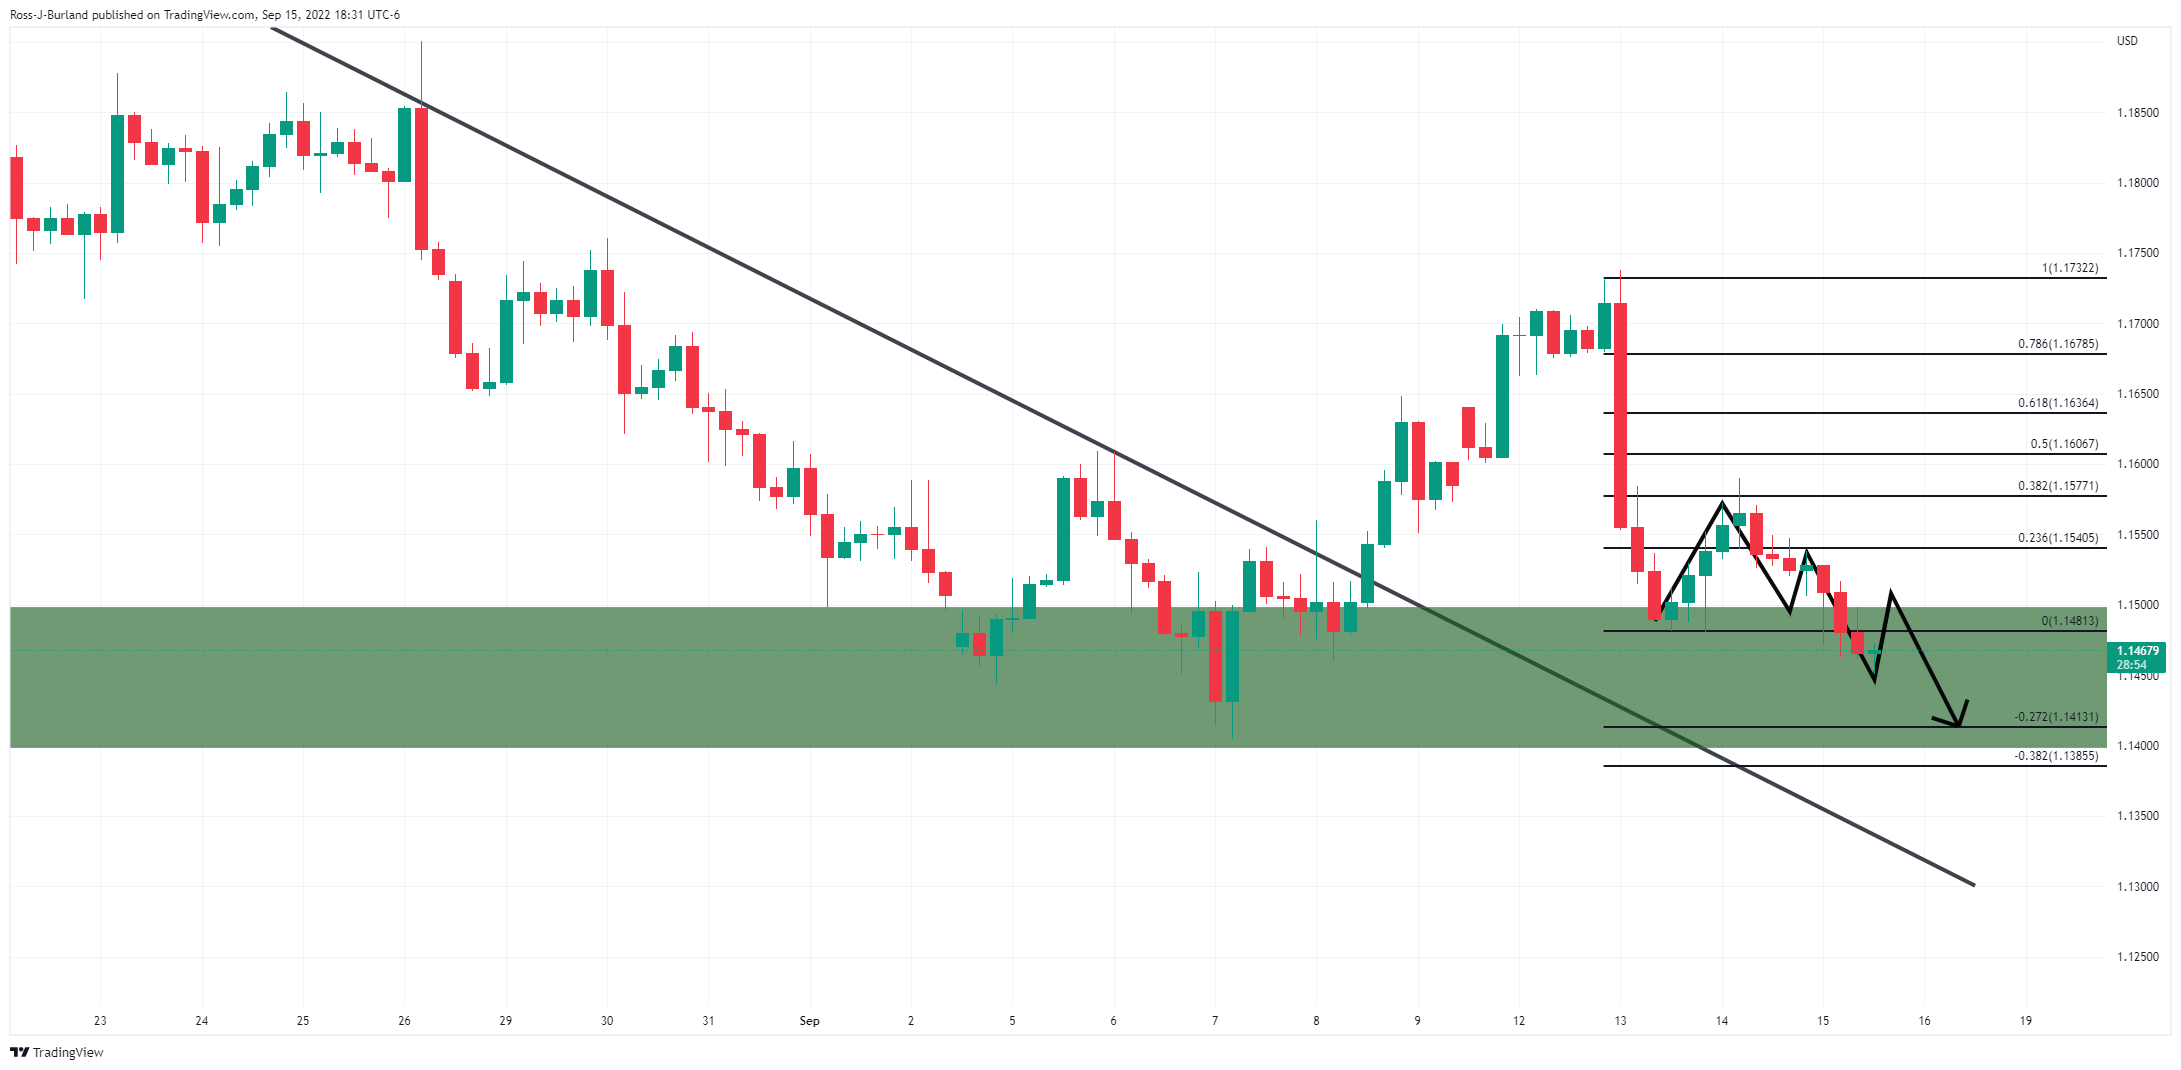
GBP/USD bulls are stepping in from 1.1450 and the following illustrates the potential for a correction followed by a deeper move into the demand structure on the longer time frames.
GBP/USD daily chart
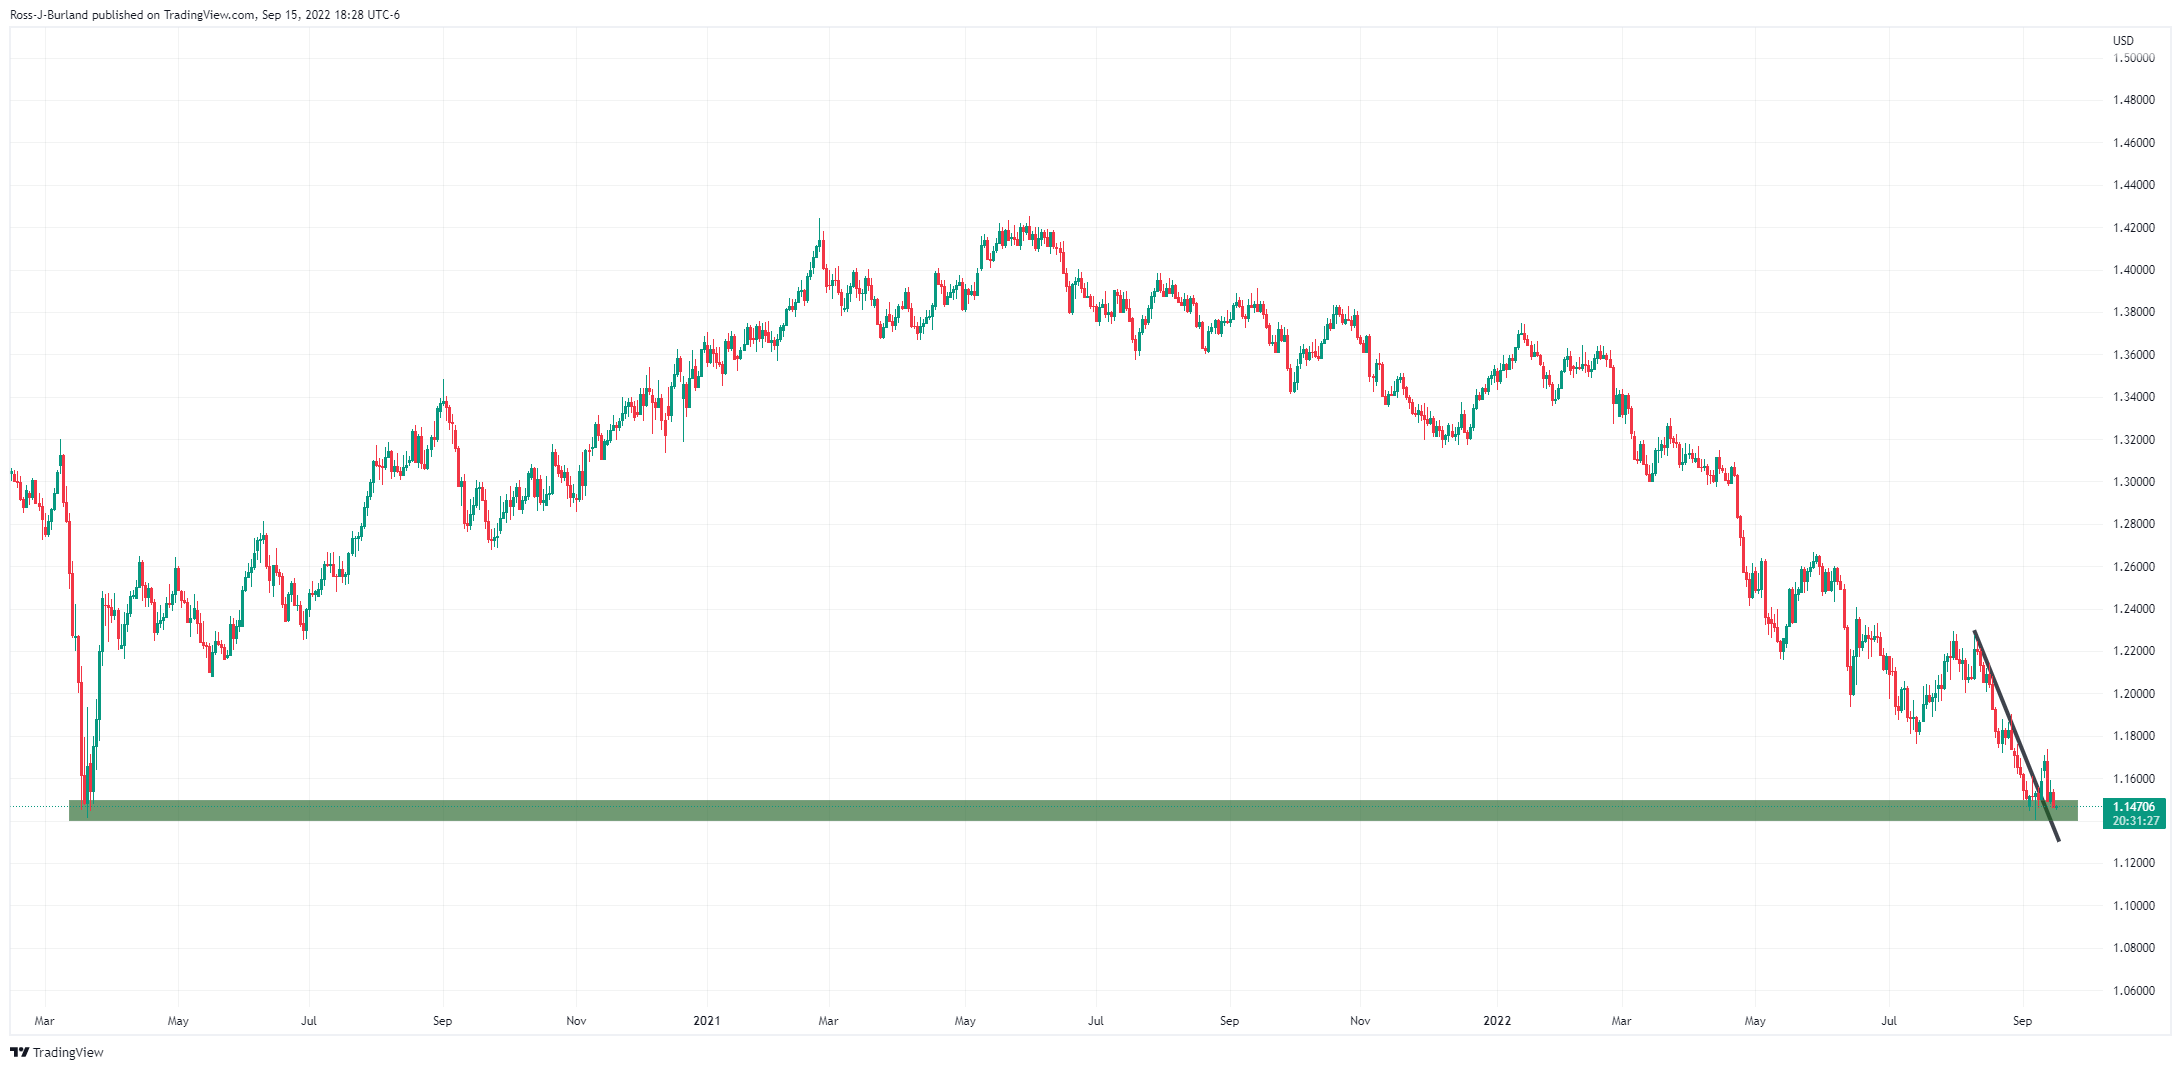
The daily chart shows that the price is at a critical demand area.
Zooming in, however, there is the potential of a move lower into the demand area.
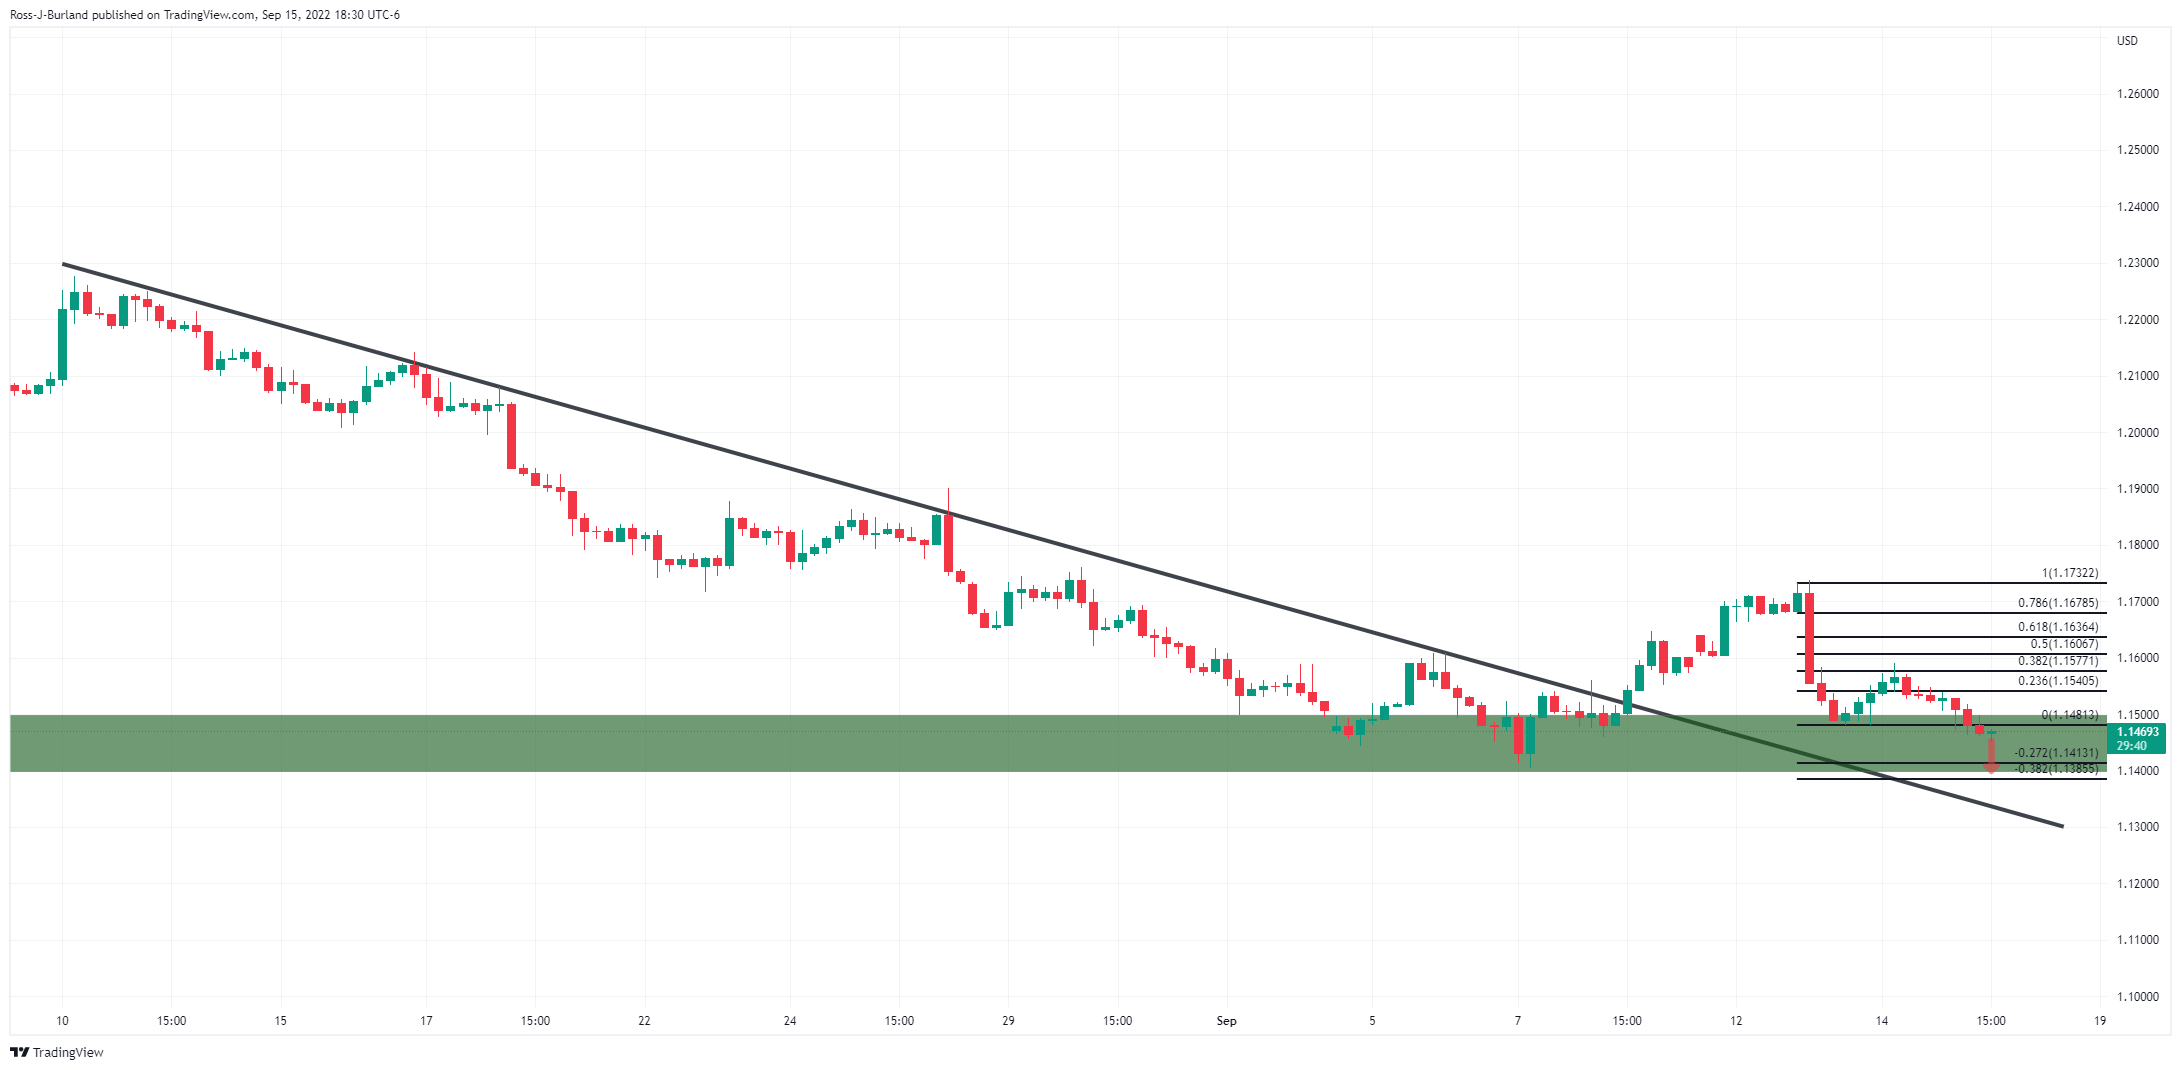
GBP/USD H4 chart
Meanwhile, the price is starting to correct into a 38.2% Fibonacci retracement area:
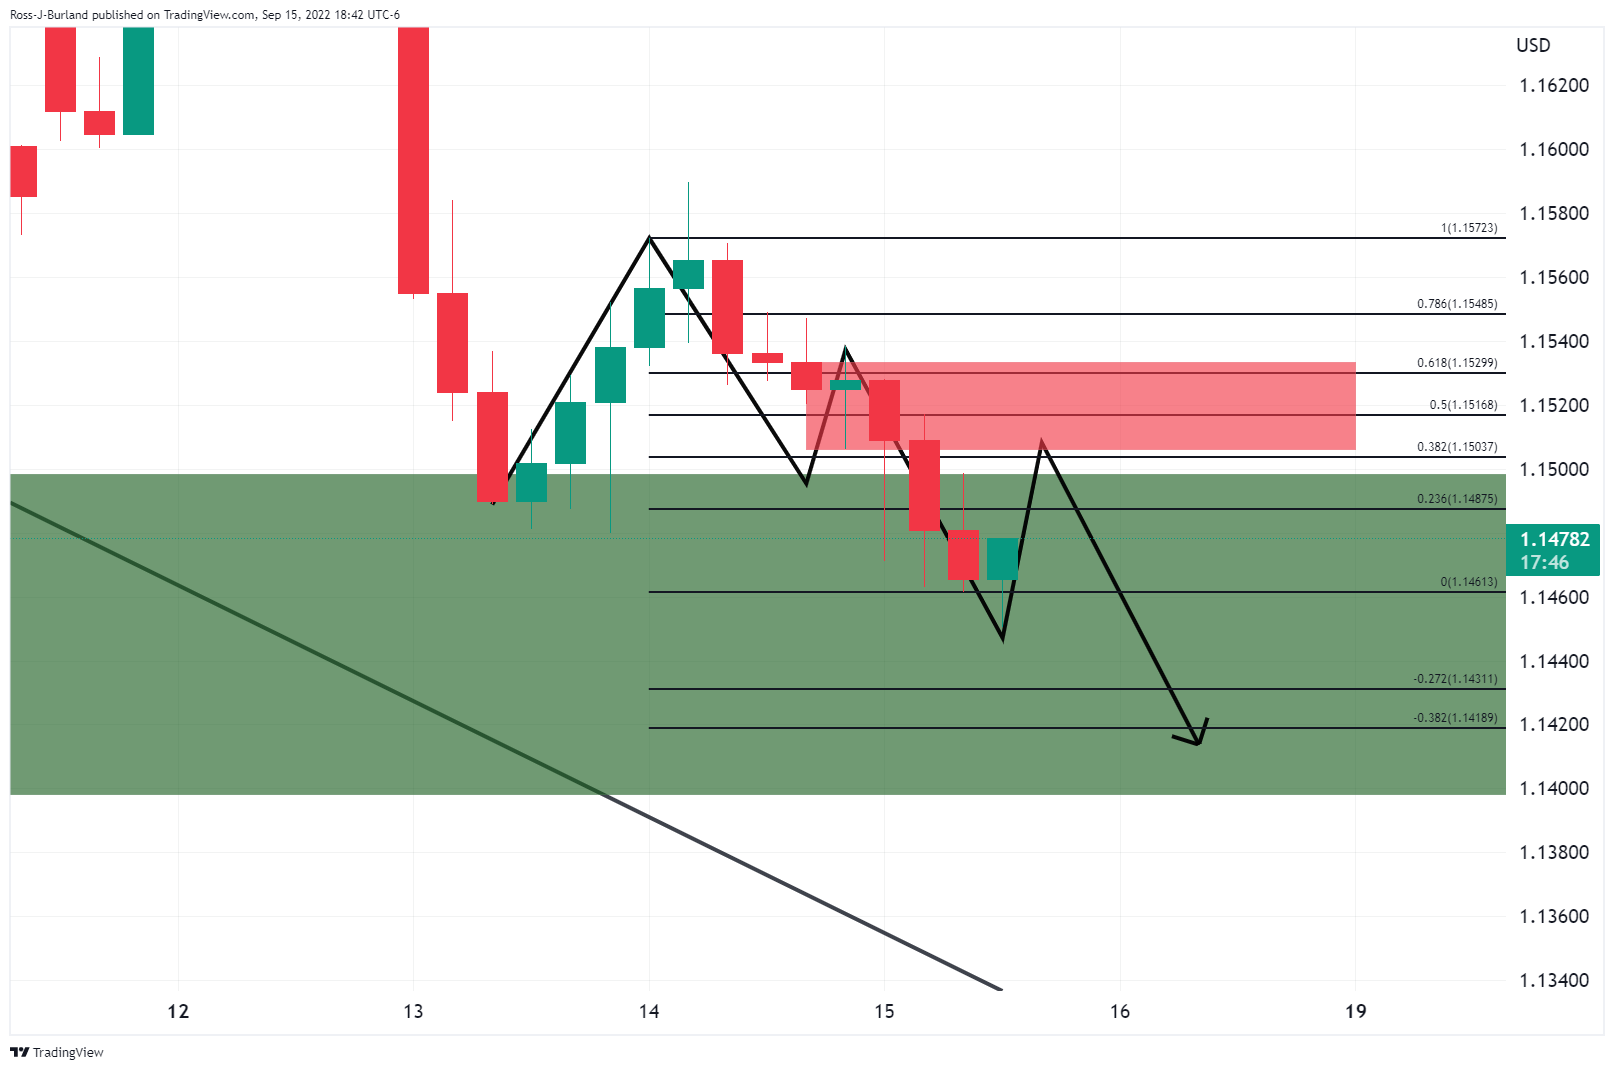
As shown, there is a confluence of the prior lows and the 38.2% and 50% ratios that could act as resistance and result in the next bearish leg.


