
- Gold bulls have eyes on a 61.8% Fibo monthly target of $1,850.
- Shorter-term, the bears can target at least a drift to a 38.2% Fibo at 1.807 or the daily support, near $1,800.
- Will NFP be the catalyst to test the commitments at $1,820/25 on a soft US dollar?
Update: Gold (XAU/USD) is holding the higher ground, closing in on the three-month highs of $1822 reached earlier in the Asian session. The price of gold is up nearly 3% this week, on track to register the best week in six months. The bearish undertone in the US dollar and Treasury yields, especially after the latest dovish comments from the Fed policymakers, continue to offer support to gold.
Investors eagerly await the US NFP report for the next direction in gold prices. Only an NFP blowout could stem the upsurge in gold, as it would rei-ignite the Fed’s tapering expectations. The headline payrolls are seen rising by 978K in April vs. 916K recorded in March.
Read: Gold Price Forecast: XAU/USD eyes $1840, overbought conditions, NFP could play spoilsports
Update: Gold (XAU/USD) bulls catch a breather around $1,820, up 0.24% intraday, after printing the fresh high since mid-February ahead of Friday’s European session open. Gold buyers earlier cheered the hopes of extended monetary policy, as suggested by the Fed policymakers, as well as the faster coronavirus (COVID-19) vaccinations due to the latest drive to waive vaccine patents. However, the risk-on mood fades as traders from Brussels turn cautious ahead of the key US Nonfarm Payrolls data.
Gold recently takes clues from the market optimism and hence a pullback in stock futures as well as the US 10-year Treasury yields, seem to have weighed on the prices. Even so, gold buyers remain hopeful as the US employment report for April is likely to print strong job numbers.
Update: Gold (XAU/USD) is consolidating near three-month highs of $1818 so far this Friday, having witnessed a blistering rally finally above the $1800 level on Thursday. The main catalyst behind gold’s over 1% surge was the dovish Fed expectations. Markets continue to believe that the Fed will continue with its accommodative monetary policy stance, despite the strengthening economic recovery.
US stocks rose on expectations of the Fed’s easy policy for longer while the Treasury yields tumbled alongside the dollar. The price of gold ignored strong US Jobless Claims, as all eyes remain on Friday’s NFP data, which is expected to show a rise of 978K last month. Monthly 50-SMA near $1835 could keep a lid on gold prices.
Read: US Nonfarm Payrolls April Preview: When the economy booms, its all about rates
Gold prices were well and truly bid on Thursday as the US dollar took a trip to the downside.
XAU/USD had added some 1.57% by the close of play on Wall Street after travelling from a low of $1.782.04 to break the psychological $1,800 level and to go on to score a high of $1,818.13.
The US dollar slipped to its lowest point in three days as global market risk appetite improved.
The DXY was losing around 0.4% by the close after falling from a high of 91.37 to a low of 90.88.
US jobs data was the focus this week.
Fewer Americans filed new claims for unemployment benefits COVID-19 vaccination efforts and massive amounts of government stimulus led to a further reopening of the economy.
With that being said, Federal Reserve speakers have continued to downplay the risks of higher inflation this week.
Ahead of Friday’s Nonfarm Payrolls, the data on Thursday proved that the number of jobs cut by US companies fell 25% MoM in April and was down a huge 96.6% for the year.
Initial Jobless Claims fell to the lowest level since mid-March 2020. Markets are expecting that core inflation will likely consistently exceed the Fed’s target over the next few years but the Fed is not expected to begin hiking interest rates until 2023.
NFP matters for gold market
For the day ahead, analysts at Westpac see ''1.1mn new jobs and believe further upward revisions to prior months could also be seen.''
The analysts argue that this should see the unemployment rate fall to 5.8%.
Moreover, they said average hourly earnings should edge up a more muted 0.1%, given the remaining slack in the labour market.
Meanwhile, it may take a surprise in the data to really convince the market that the Fed will taper or raise rates sooner than they would like to.
Prior analysis, weekly gold chart
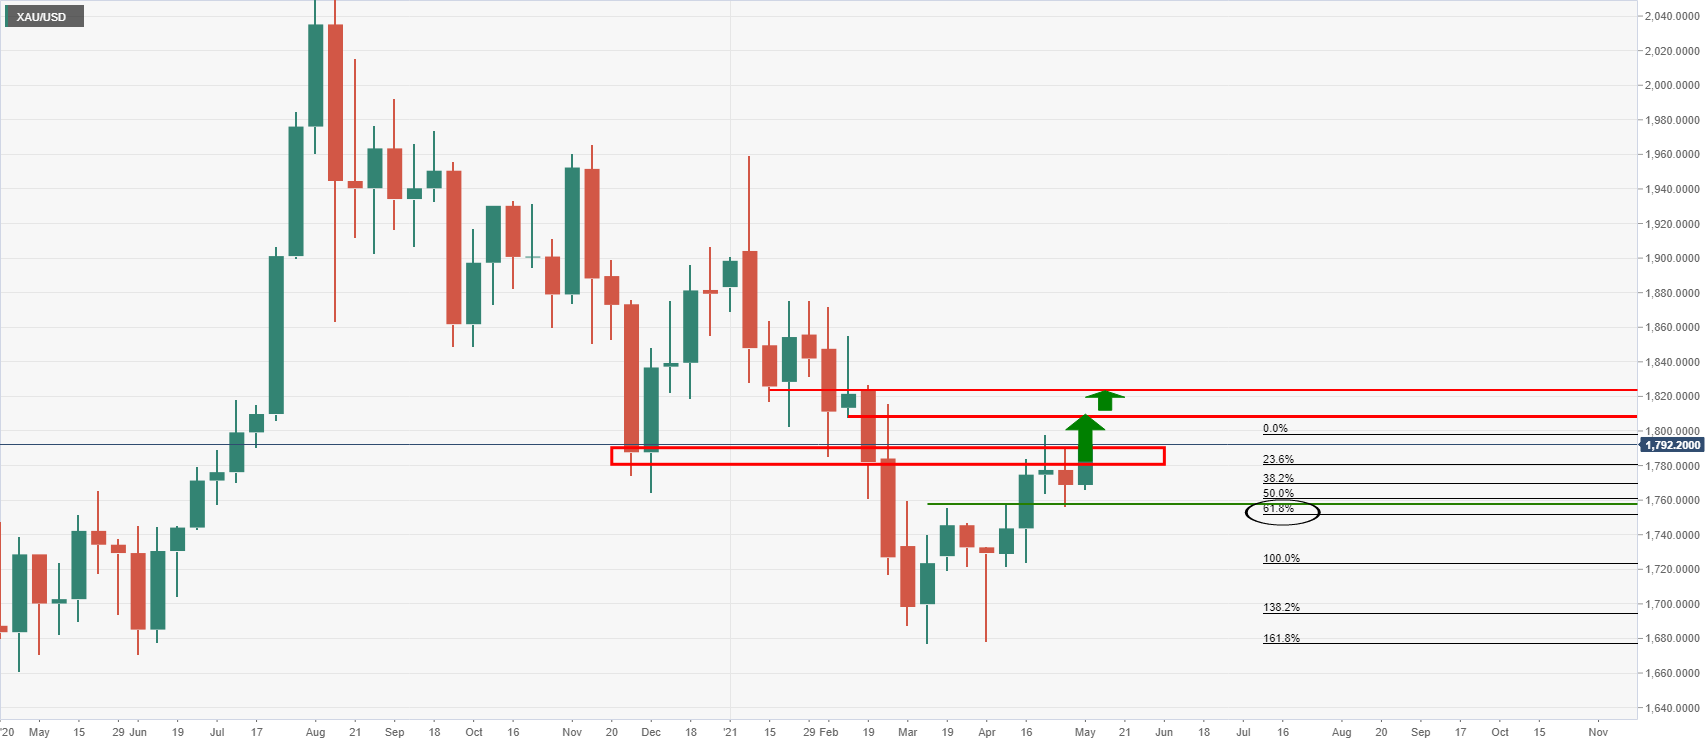
Source: Gold Price Analysis: Bulls back in town through critical resistance
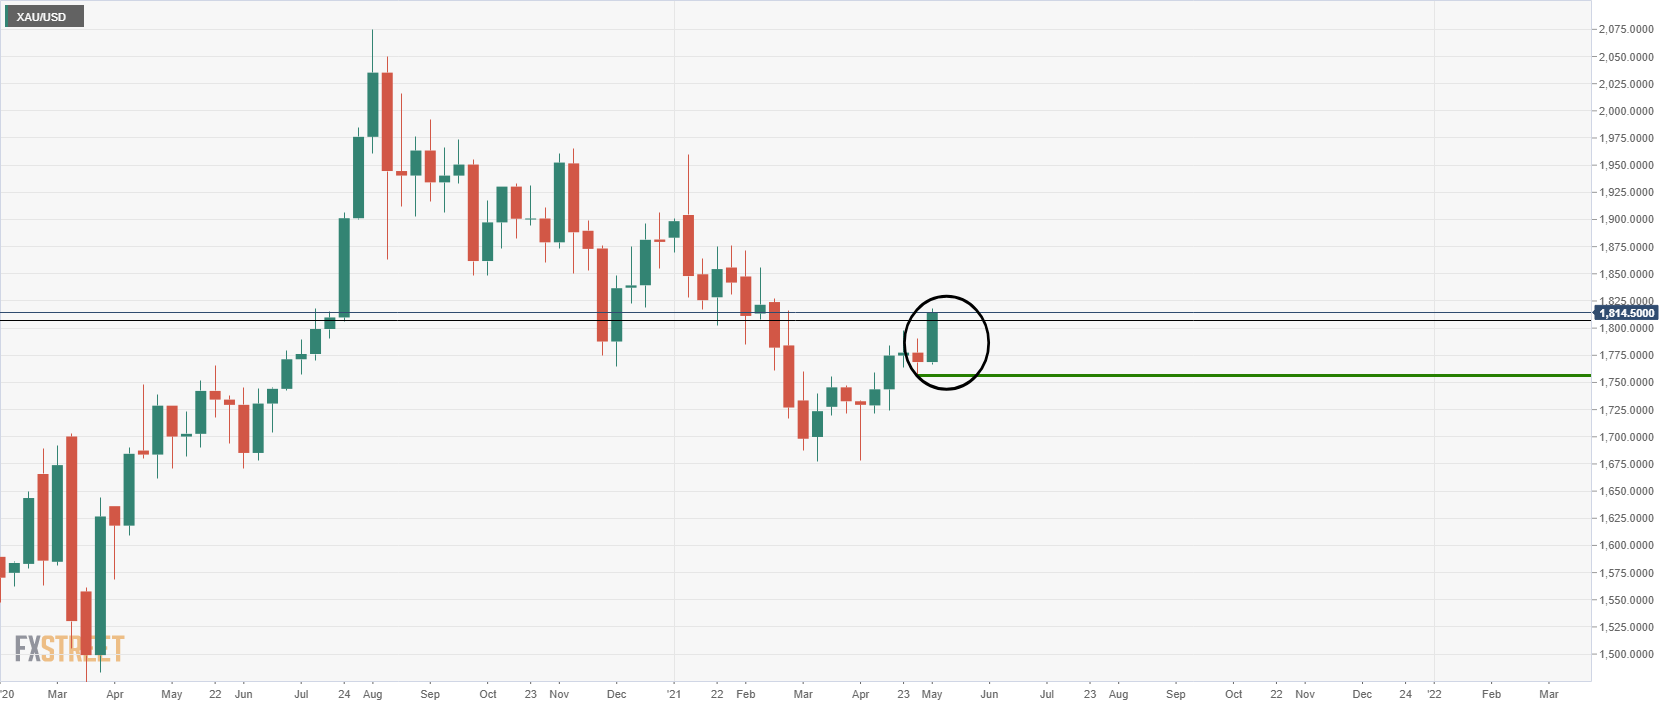
Live market, weekly gold chart
Meanwhile, the prior gold news that has been updated throughout the past few sessions identified various levels in using the Technical Confluences Detector and by eye.
Here is that gold article: Gold Price Analysis: Gold bears seeking a correction to test bullish commitments
It was noted that ''The Technical Confluences Detector is pointing to showing that the next resistance line is at around $1,822, which is where the Pivot Point one-week Resistance 3 hits the gold price chart.''
Other levels of not were as follows, ''The next substantial hurdle for XAU/USD awaits at $1,850, which is the convergence of the 200-day Simple Moving Average and the Pivot Point one-month Resistance 2.
Initial support is at around $1,810, which is where the PP one-month R1, the PP one-day R3 and the Fibonacci 161.8% one-week all meet up on the gold price chart.''
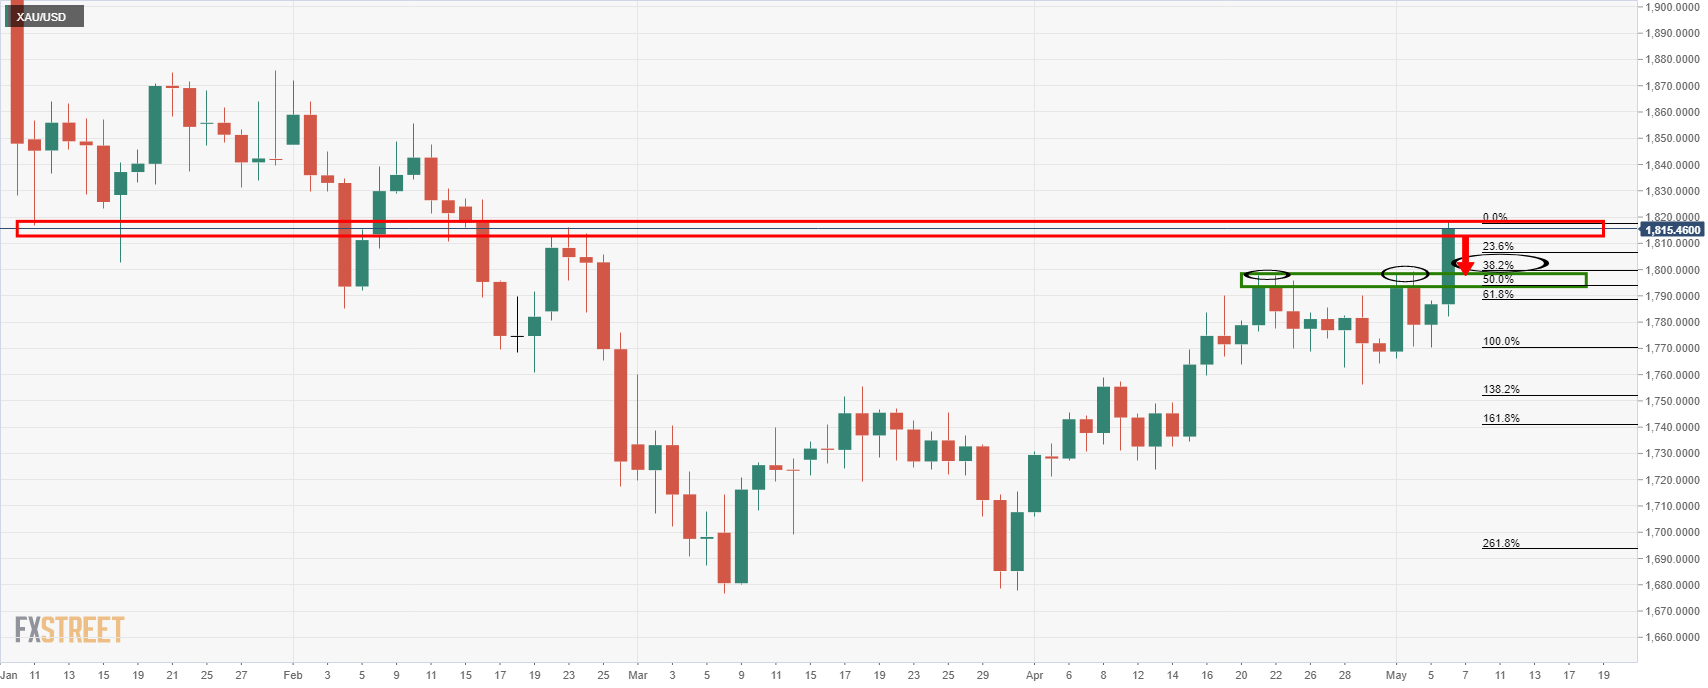
Meanwhile, from a pure price action analysis and forecast, using the Fibonaccis and typical price action habits, the following was presumed:
Considering that the gold price has now reached a resistance structure, and given the daily ATR of around $21, gold can easily drop back to ''test the prior resistance which has a confluence with a 38.2% Fibonacci retracement of the latest bullish impulse.''
Daily gold charts, prior analysis
The daily gold chart zoomed-in, live market
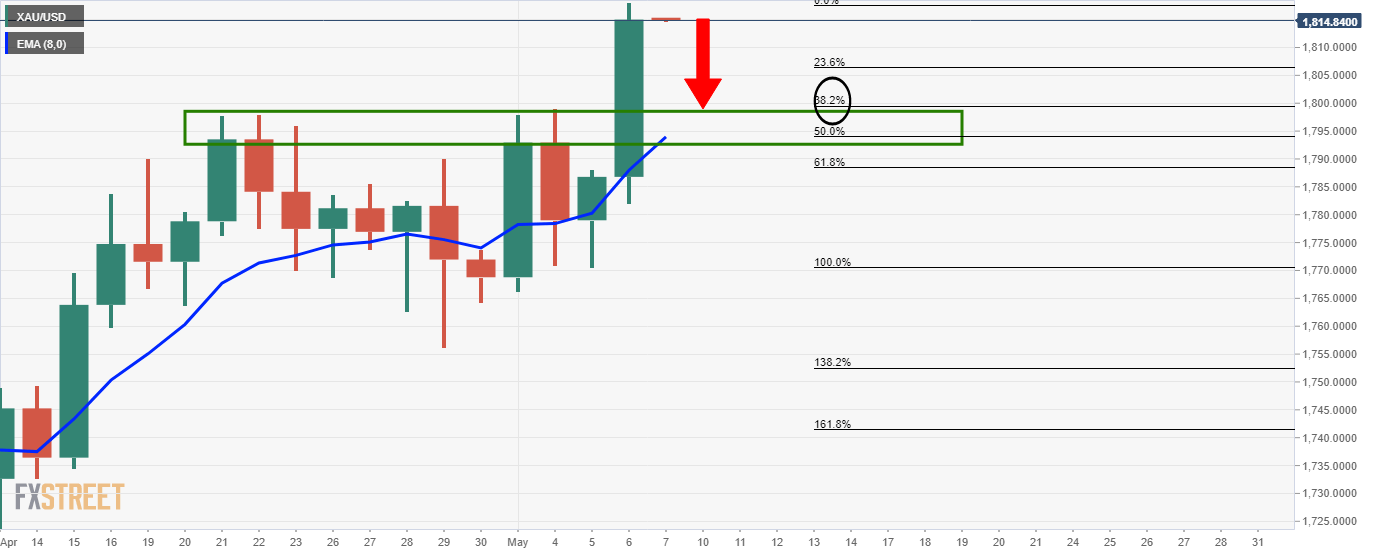
Nearer term, however, and while considering that the Nonfarm Payrolls is just around the corner, should the market take a breather, ''on the hourly time frame, there is a compelling case for demand higher up at the confluence of the daily 23.6% Fibo that meets the hourly 38.2% Fibo and the 10 EMA.''
1-hour gold chart, prior analysis
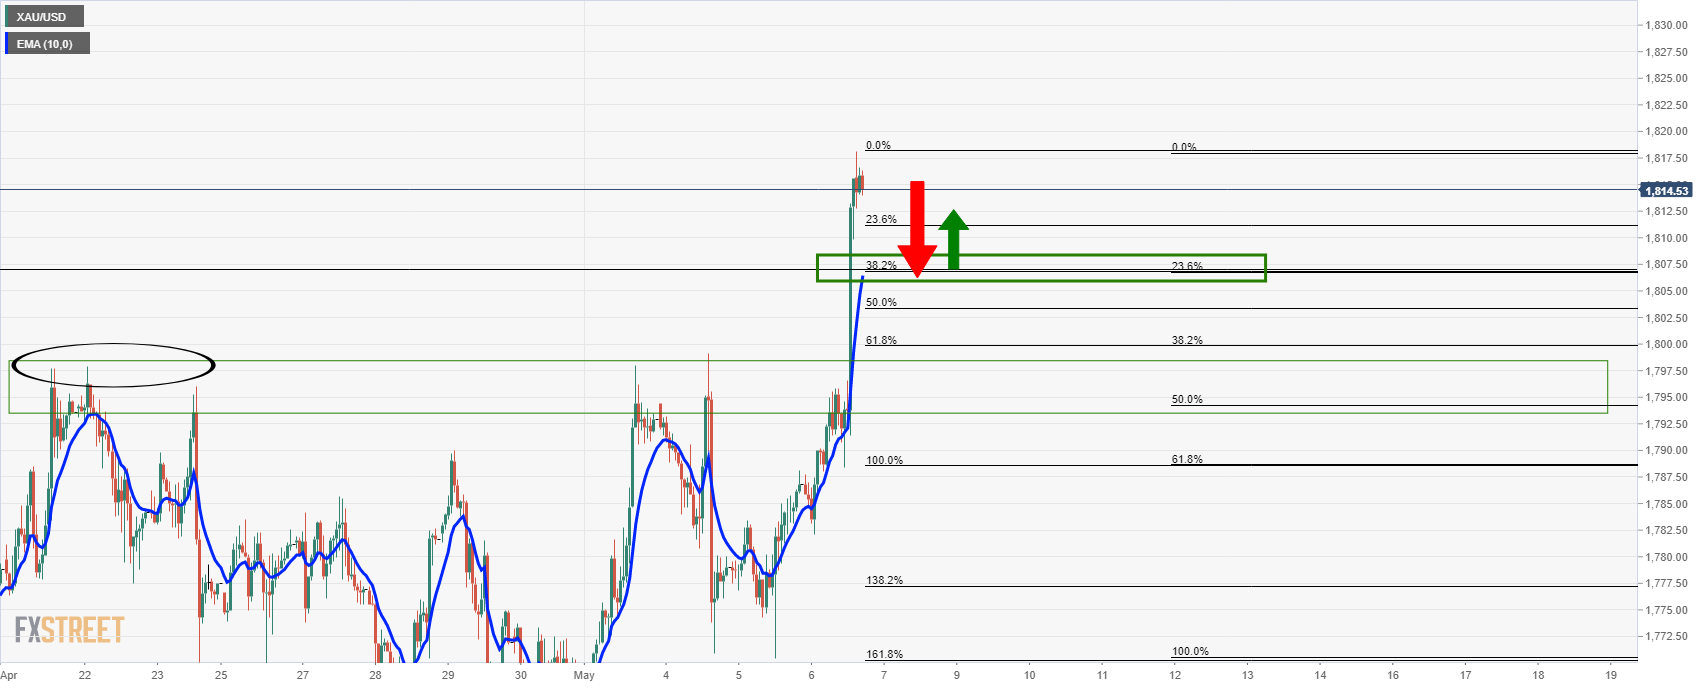
Live gold market, 1-hour time frame
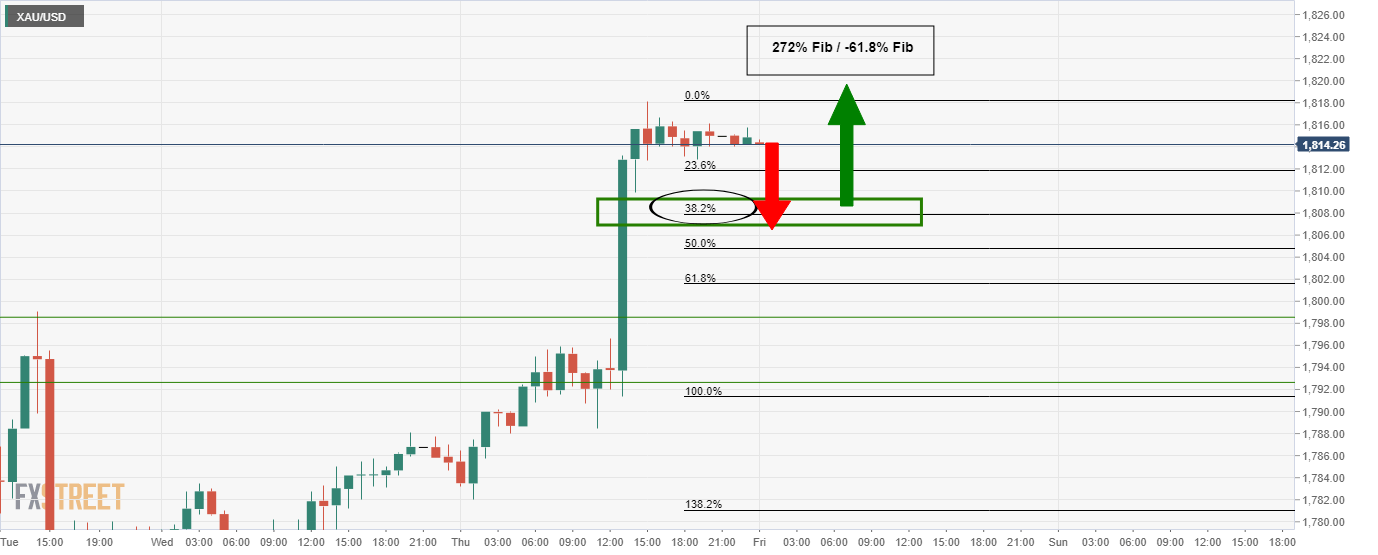
Should the Nonfarm Payrolls 'only' live up to expectations or indeed even disappoint, then we have a scenario where the US dollar could continue to fall and support gold prices.
The thesis is that the Federal Reserve will look through transitory rises in inflation and keep benchmark interest rates around zero for the foreseeable future. That' risk on and also bearish for real yields.
This combination should, in theory, be positive for gold and negative for the US dollar.
A drift lower to the 38.2% Fibo could be met with demand and the price could well make an onwards extension to test the targetted box between the -272% and 61.8% Fib retracements of the forecasted hourly correction's range.
This area guards a run to the aforementioned $1,850 target area on the monthly chart:
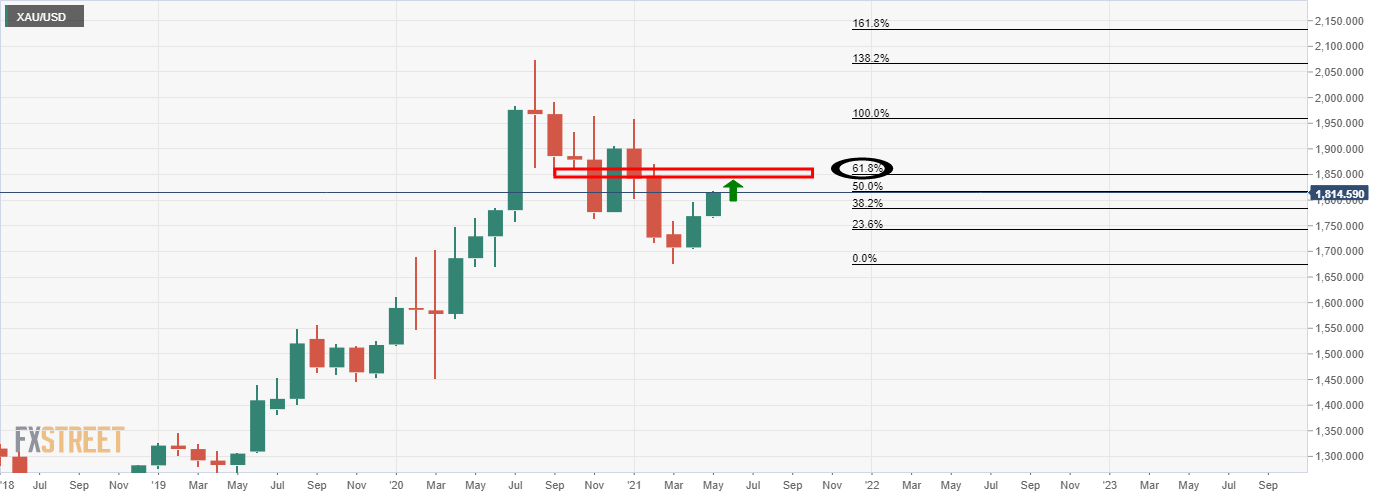
For a longer-term in house FXStreet outlook for the gold price, the following can be read:
Gold Price Forecast 2021: XAU/USD looks to build on 2020 gains with central banks staying dovish


