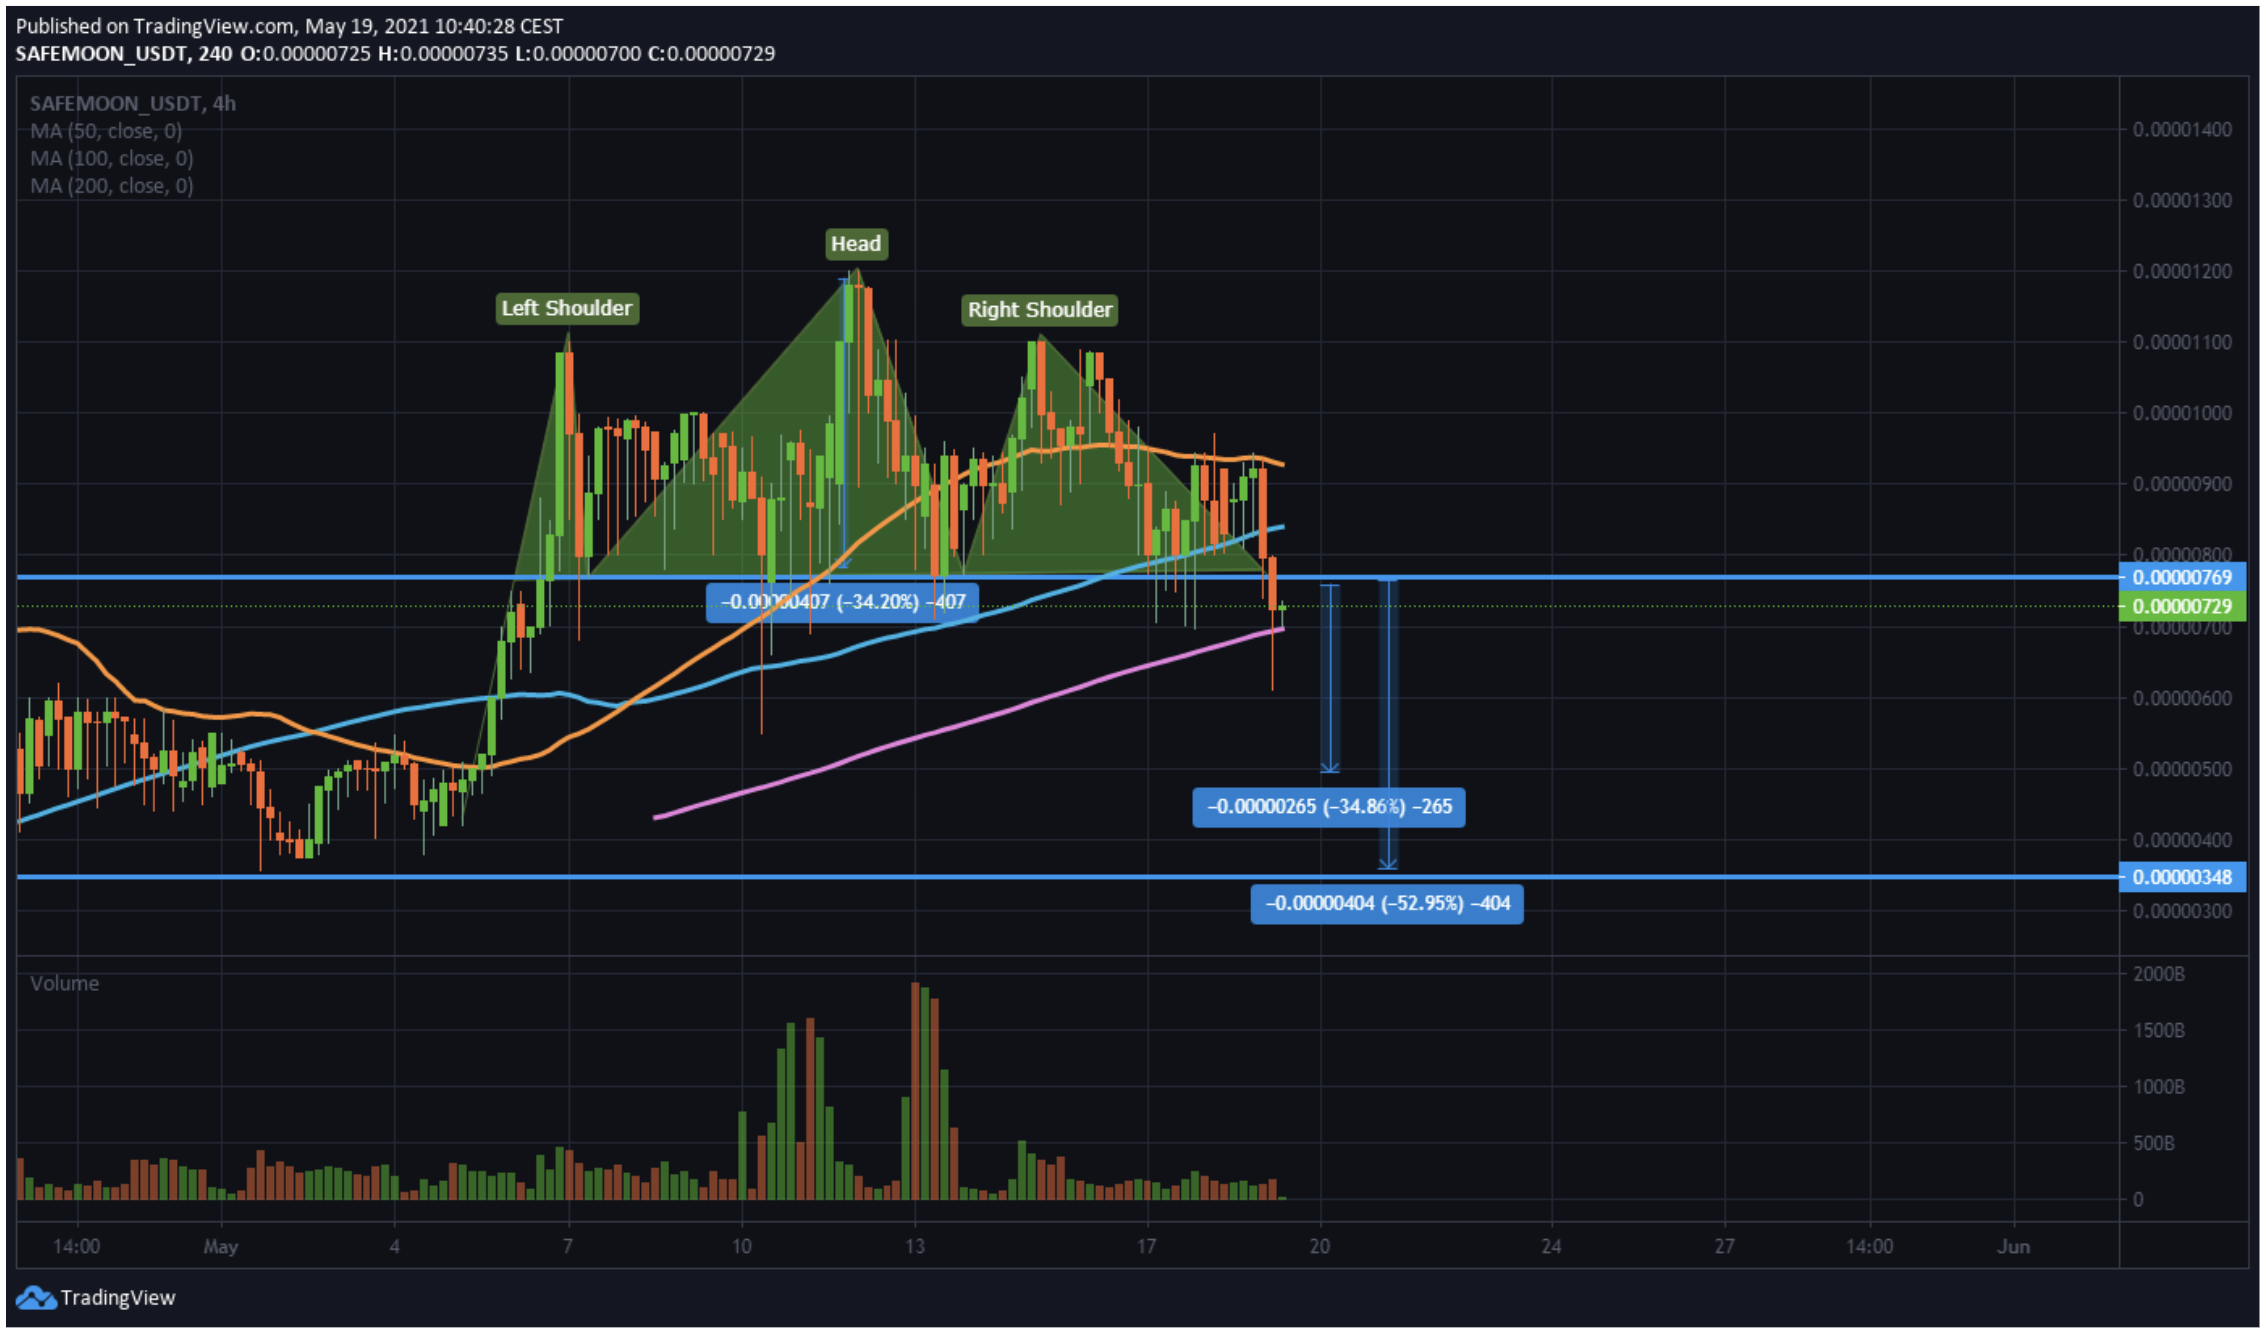
- SafeMoon price seems to have formed a trend reversal pattern on the 4-hour chart.
- If validated, a spike in selling pressure could see SAFEMOON drop by more than 34%.
- The only support barrier that may keep falling prices at bay sits at $0.0000070.
SafeMoon looks primed for a massive correction after losing the $0.0000077 support level.
SafeMoon price to suffer significant losses
SafeMoon price appears to have developed a head-and-shoulders pattern on its 4-hour chart. Although the pattern’s neckline at $0.0000077 has been violated, the 200 four-hour moving average at $0.0000070 seems to be acting as support.
Breaking through this demand barrier could lead to a 35% decline. Indeed, the head-and-shoulders pattern forecasts that SafeMoon price could plummet to $0.0000049. This target is determined by measuring the distance from the pattern's head to the neckline and adding that distance down from the breakdown point.
If the selling pressure is significant enough, SafeMoon price might dive further toward $0.0000035 which has acted as a crucial support level throughout April.

SAFEMOON/USDt 4-hour chart
Invalidation of the bearish outlook would come if SafeMoon price manages to rise and stay above $0.0000077. Under such circumstances, SAFEMOON might retest the 50 four-hour moving average at $0.0000092.


