
- Shiba Inu steadies along the apex level of a symmetrical triangle pattern.
- Four inside days over the last eight trading days have not generated a sustainable SHIB range expansion.
- A daily close above the 10-day simple moving average (SMA), confirms a new rally for the meme token.
Shiba Inu price stabilization at the apex level of a symmetrical triangle is a bullish development for the briefly traded SHIB. Still, the digital asset may require a catalyst, external or organic, to facilitate a range expansion that overcomes resistance at the 10-day SMA.
Shiba Inu price searching for a large, loud and funny community
From May 19 until May 24, Shiba Inu price created a symmetrical triangle pattern with two reaction highs and three reaction lows and a measured move target of $0.00001450, representing a gain of 50%.
Shiba Inu price delivered an impulsive move from the symmetrical triangle pattern on May 24 with a 30% gain, but SHIB failed to capitalize on the breakout and quickly slipped in a downward drift, highlighted by resistance at the 10-day SMA and support at the triangle’s upper trend line.
Over the last three days, Shiba Inu price has balanced along the apex level of a symmetrical triangle around $0.00000762. The horizontal price action has created an inverse head-and-shoulders pattern on the 1-hour chart with a trigger price of $0.000000807.
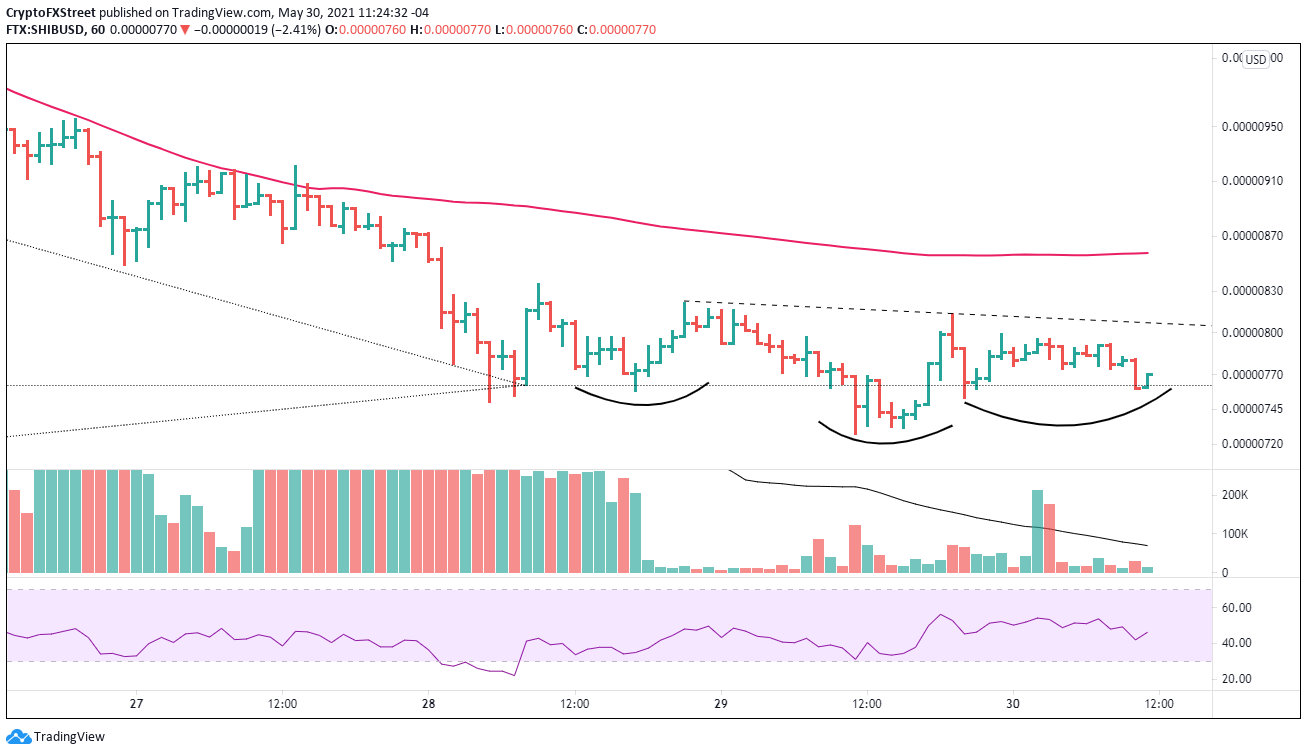
SHIB/USD 1-hour chart
A daily close above the 10-day SMA at $0.00000864 will be confirmation of a new SHIB rally.
A new Shiba Inu price rally will not encounter resistance until the price range defined by the May 24 high at $0.00001204, the May 20 high at $0.00001214 and the May 16 low at $0.00001238. If SHIB decisively breaks through the range, it should quickly test the 23.6% Fibonacci retracement of the decline from the May 10 high at $0.00001325.
The 38.2% retracement level at $0.00001793 will be a more difficult challenge as it aligns with a price cluster from May 12 to May 18. Ambitious SHIB investors will be targeting the 50% retracement at $0.00002186.
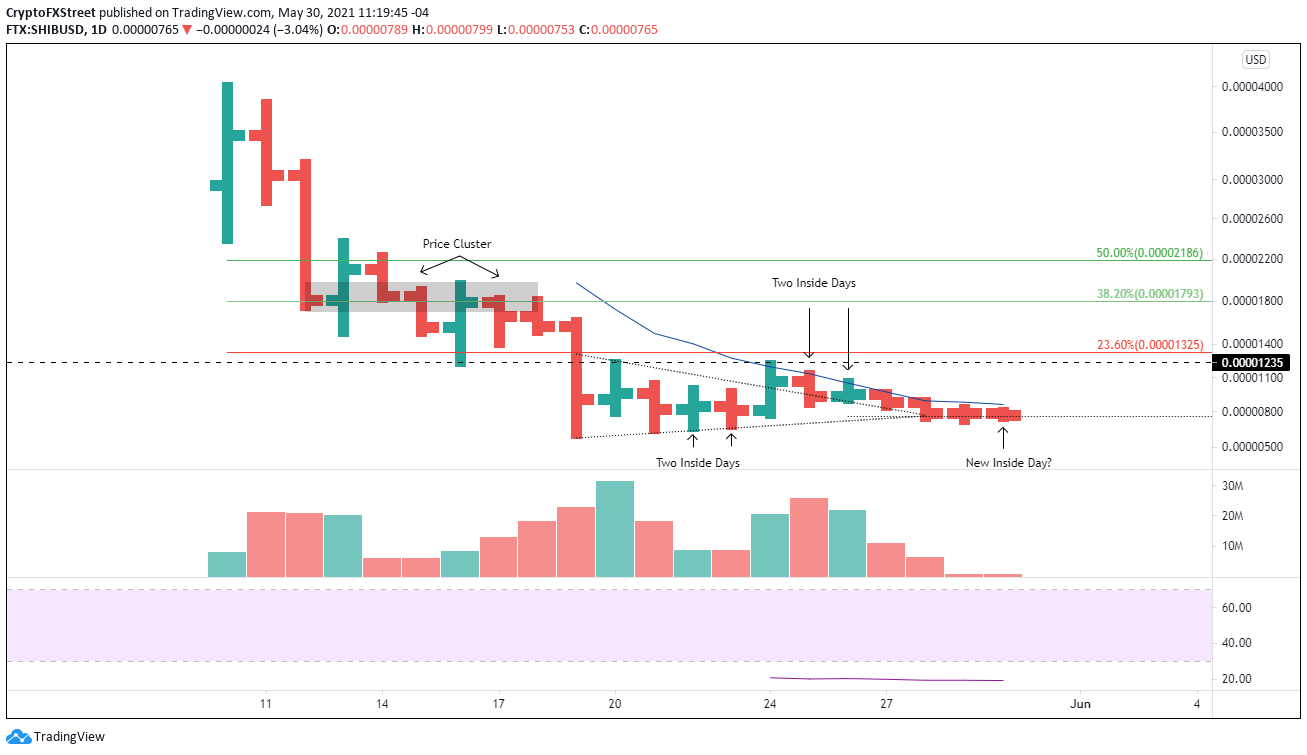
SHIB/USD daily chart
A close below the head of the head-and-shoulders pattern at $0.00000727 would void a bullish SHIB narrative. A decline below the May 19 low at $0.00000607 would confirm a negative outlook and leave Shiba Inu price vulnerable to continuing the larger downtrend originating on May 10.
For four of the past eight trading days, Shiba Inu price has closed with an inside day, reflecting an extraordinary level of indecision. Of course, some of the hesitation is a function of the volatility in the broader cryptocurrency complex. It also stems from the lack of price history to produce firm price forecasts and limited knowledge about SHIB. Hence, the cryptocurrency may require a large, loud and funny community like Dogecoin to overcome the uncertainty and drive price higher.


