
- Shiba Inu price is at a critical point as it inches closer to a massive bull run.
- The Dogecoin-killer needs to break above $0.00003037 for SHIB to reach the optimistic target of a 42% climb.
- However, a slice below $0.00002879 could spell trouble for the bulls.
Shiba Inu price appears to be consolidating following its tremendous rally of over 340% in early October to a swing high of $0.00003528. SHIB has presented a continuation pattern and is nearly at the brink of a make-or-break point. If the Dogecoin-killer manages to slice above a crucial level of resistance, it could anticipate a rally of 42%.
Shiba Inu price eyes ascent toward $0.00004346
Shiba Inu price has formed a symmetrical triangle on the 4-hour chart, indicating that the bulls may be catching their breath following the massive uptrend. While SHIB is confusing investors with directional cues, its next move could indicate a 42% ascent depending on whether the token manages to slice above a critical hurdle.
Investors should note that the bullish target would only be on the radar if Shiba Inu price breaks above the upper boundary of the triangle pattern at $0.00003037. Only if SHIB manages to escape above the aforementioned resistance, would the prevailing chart pattern project a 42% ascent toward $0.00004346, coinciding with the 127.2% Fibonacci retracement level.
However, Shiba Inu price may face a few obstacles before reaching the optimistic target. The first hurdle above the topside trend line of the triangle emerges at $0.00003073, the October 13 high. Additional obstacles may arise at $0.00003200 and $0.00003528, the October 11 high and October 7 high, respectively.
The Momentum Reversal Indicator (MRI) also presents a breakout line at $0.00003559, which indicates that this area would be crucial to crack before Shiba Inu price could climb toward its aforementioned bullish target.
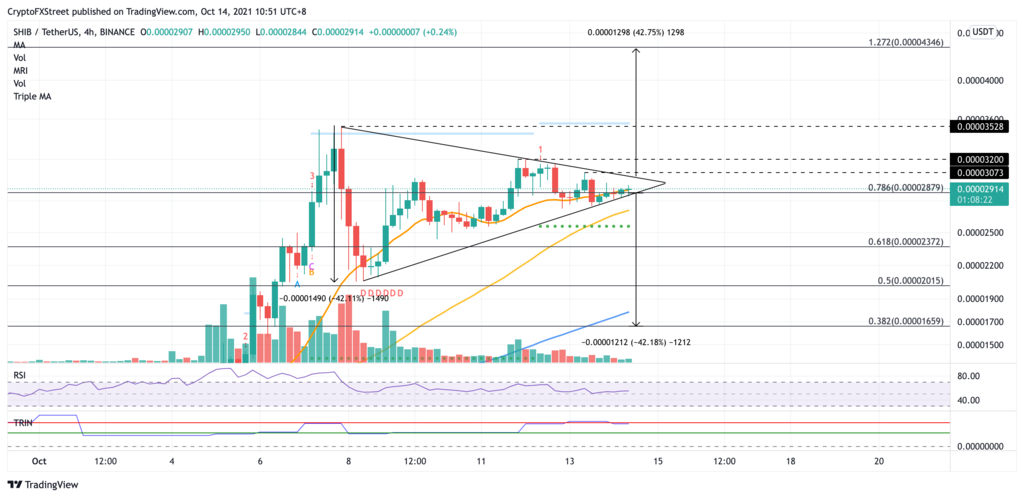
SHIB/USDT 4-hour chart
If Shiba Inu faces a spike in sell orders, SHIB may resort to its first line of defense at the 20 four-hour Simple Moving Average (SMA) at $0.00002879, coinciding with the 78.6% Fibonacci retracement level. Investors should also note that a slice below this level could put the token in danger of a 42% decline toward $0.00001659, coinciding with the 28.2% Fibonacci retracement level, given by the prevailing chart pattern.
However, additional support may appear at the 50 four-hour SMA at $0.00002712, then at the support line given by the MRI at $0.00002562. Further lines of defense will emerge at $.0.00002372, $0.00002015 and $0.00001784, the 61.8% Fibonacci retracement level, the 50% Fibonacci retracement level and the 100 four-hour SMA, respectively.


