
- Shiba Inu price witnessed a 6% decline on Monday.
- SHIB may need more time to depict the next move based on factors mentioned below.
- Invalidation of the bearish scenario would be a break above $0.00001295.
Shiba Inu price is witnessing a decline, but the technicals are still uncertain. Key levels have been defined to depict a plausible outcome for the notorious meme coin's price trajectory.
Shiba Inu price headed south?
Shiba Inu price is enduring the bearish force as the world's favorite dog coin is down 6% on the day. Since January 1, the self-proclaimed Dogecoin-killer token has risen by 66%. Throughout the rally, the bulls have faced little challenge, brief consolidations followed by additional surges in price. As January comes to an end, the SHIB token shows a slight change in market behavior, which could lead to a profitable opportunity for day traders.
Shiba Inu price currently auctions at $0.00001130. The 6% decline is returning to retest the higher low produced on January 24th when it fell by 7%. The mentioned liquidation was the largest sell-off throughout SHIB's newfound uptrend. At the time of writing, the 21-day simple moving average (SMA) hovers just below the level and remains untested since January 3, when it helped catalyze SHIB’s 66% surge.\
Shiba Inu price is in a peculiar situation for traders looking to enter the market now. The reason is that the 8-day exponential moving average (EMA) has already been breached, so bears who enter the market early are already in substantial profit. The 21-day simple moving average has yet to be breached, and the potential to find strong support at the level is valid.
Additionally, the Relative Strength Index (RSI), an indicator used to gauge the potential of a future swing trade by comparing and contrasting previous rallies, is displaying a bullish divergence between the January 24 low at $0.00001090 and the current auctioning price. Bullish divergence patterns are commonly found before a market reversal, as they indicate the underlying strength of buyers despite declining prices.
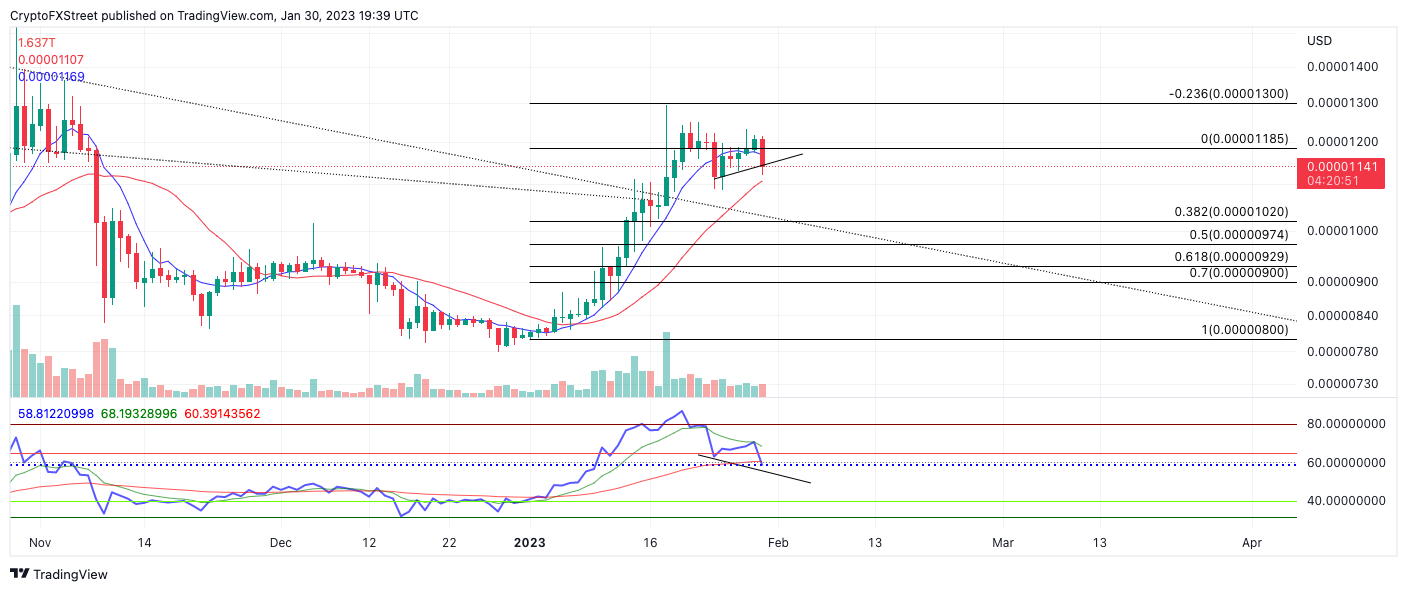
SHIB/USDT 1-day chart
Thus, this thesis remains neutral. If the 21-day simple moving average at $0.00001100 is breached, the next bearish target zone would be between the 38.2% and 50% retracement levels of January's 66% rally at $0.00001020 and $0.00000974. The bearish scenario creates the potential for a 12% decline from Shiba Inu's current market value.
It is worth noting that a daily close and candlestick above January's high at $0.00001294 would invalidate the bearish trade idea and setup an opportunity to go long. Under the bullish scenario, SHIB is likely to rally back toward the $0.00001400 liquidity zone, resulting in a 20% increase in market value.


