
- Bitcoin price is down 2.5% on the day, but the trend remains bullish.
- Ethereum price has declined by 5% and could be the first sign of a deeper decline.
- XRP witnesses a 3.5% downswing and shows room for more sell-offs.
The crypto market is witnessing an influx in bearish activity. Key levels have been defined to forecast where the top three cryptocurrencies may be priced going into February.
Bitcoin price down but not dead
Bitcoin price is witnessing resistance near the mid-$23,000 area. Since January 1, the digital currency has rallied by 45% in a jaw-dropping fashion. Throughout the surging trend, the BTC price has pulled back only for a day or so before continuing its ascension. On January 30, the BTC price witnessed its largest solo drop for the month. At the time of writing, the Bitcoin price registers a 2.5% decline in market value.
Bitcoin price currently auctions at $23,165. Although the largest red day is no worthy change in market behavior, several factors portray that BTC is still in a healthy uptrend. For instance, the bears have yet to produce a settling price beneath the average. The 8-day exponential moving average (EMA) often provides support for a trend during the third impulsive wave, also known as the strongest part of the rally. A candlestick close beneath the barrier usually results in a steeper three-wave correction, known as wave four.
The Volume Profile indicator correlates with the moon-shot narrative as the bulls remain in control according to the Binance exchange API. Despite all of the bears’ attempts throughout the month, the strongest candle belongs to the bulls, with an influx of $454,000 transactions occurring on January 12.
Combining all of these factors, Bitcoin price is still on an uptrend until market conditions change. The next bullish targets are likely liquidity levels between $24,000 and the mid-$24,000 zone. The bullish scenario creates the potential for a 6% rise from the current BTC price.
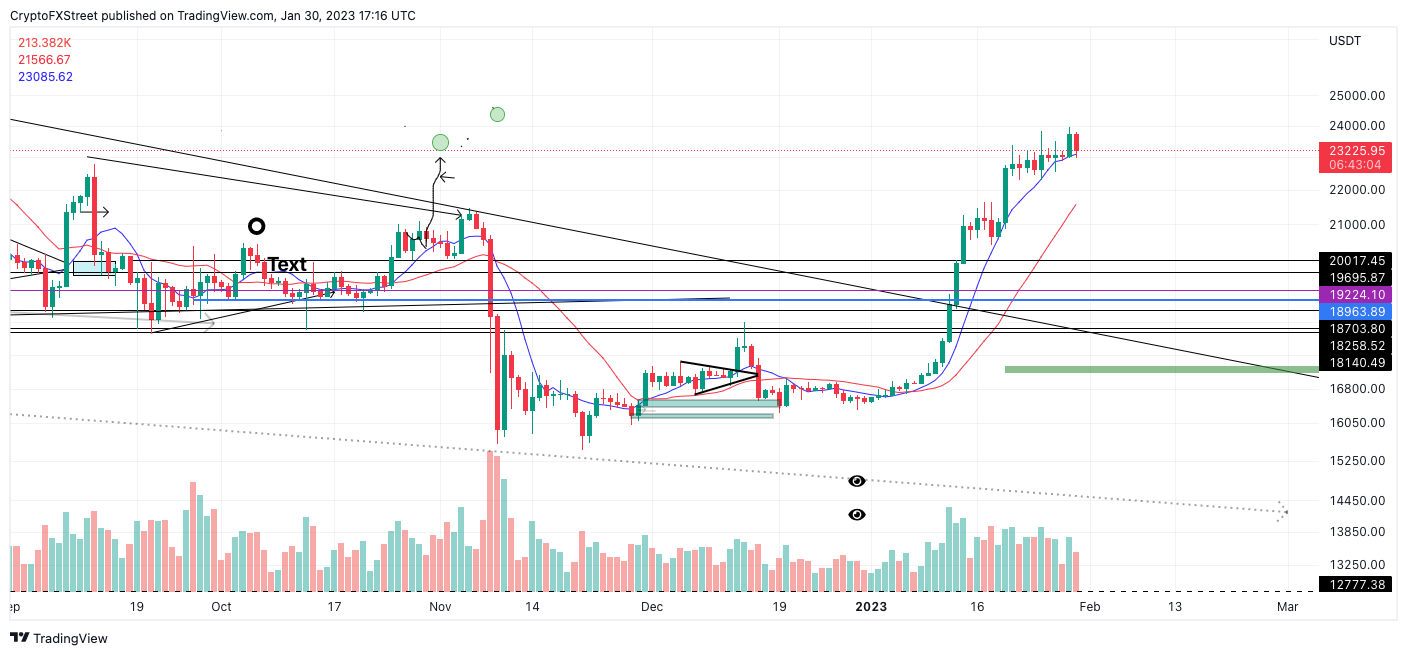
BTC/USDT 1-Day Chart
Invalidation of the bullish thesis could occur if the bears produce a closing candlestick beneath the 8-day EMA at $23,000. In doing so, the bears could reroute south and test previous resistance zones near $21,000, resulting in a 7% decline from Bitcoin’s current market value.


