
- Ethereum price seems to have bounced off the 21-week EMA at $2,100 but shows no signs of continuing it.
- On-chain metrics point to a short-term bearish outlook for ETH.
- From a long-term perspective, fundamentals indicate a vibrant future for the smart contract platform.
Ethereum price seems to have found support on the 21-week Exponential Moving Average (EMA), which has paused the downswing momentarily. While a continuation of the rally seems logical, several on-chain metrics point to a rather off-putting outlook for ETH.
Ethereum price hangs in the balance
Ethereum price crash in the last week of May, although brutal, managed to produce a weekly close above the 21-week EMA at $2,100. ETH has already rallied 20% from this ricochet and hints at continuing this uptrend.
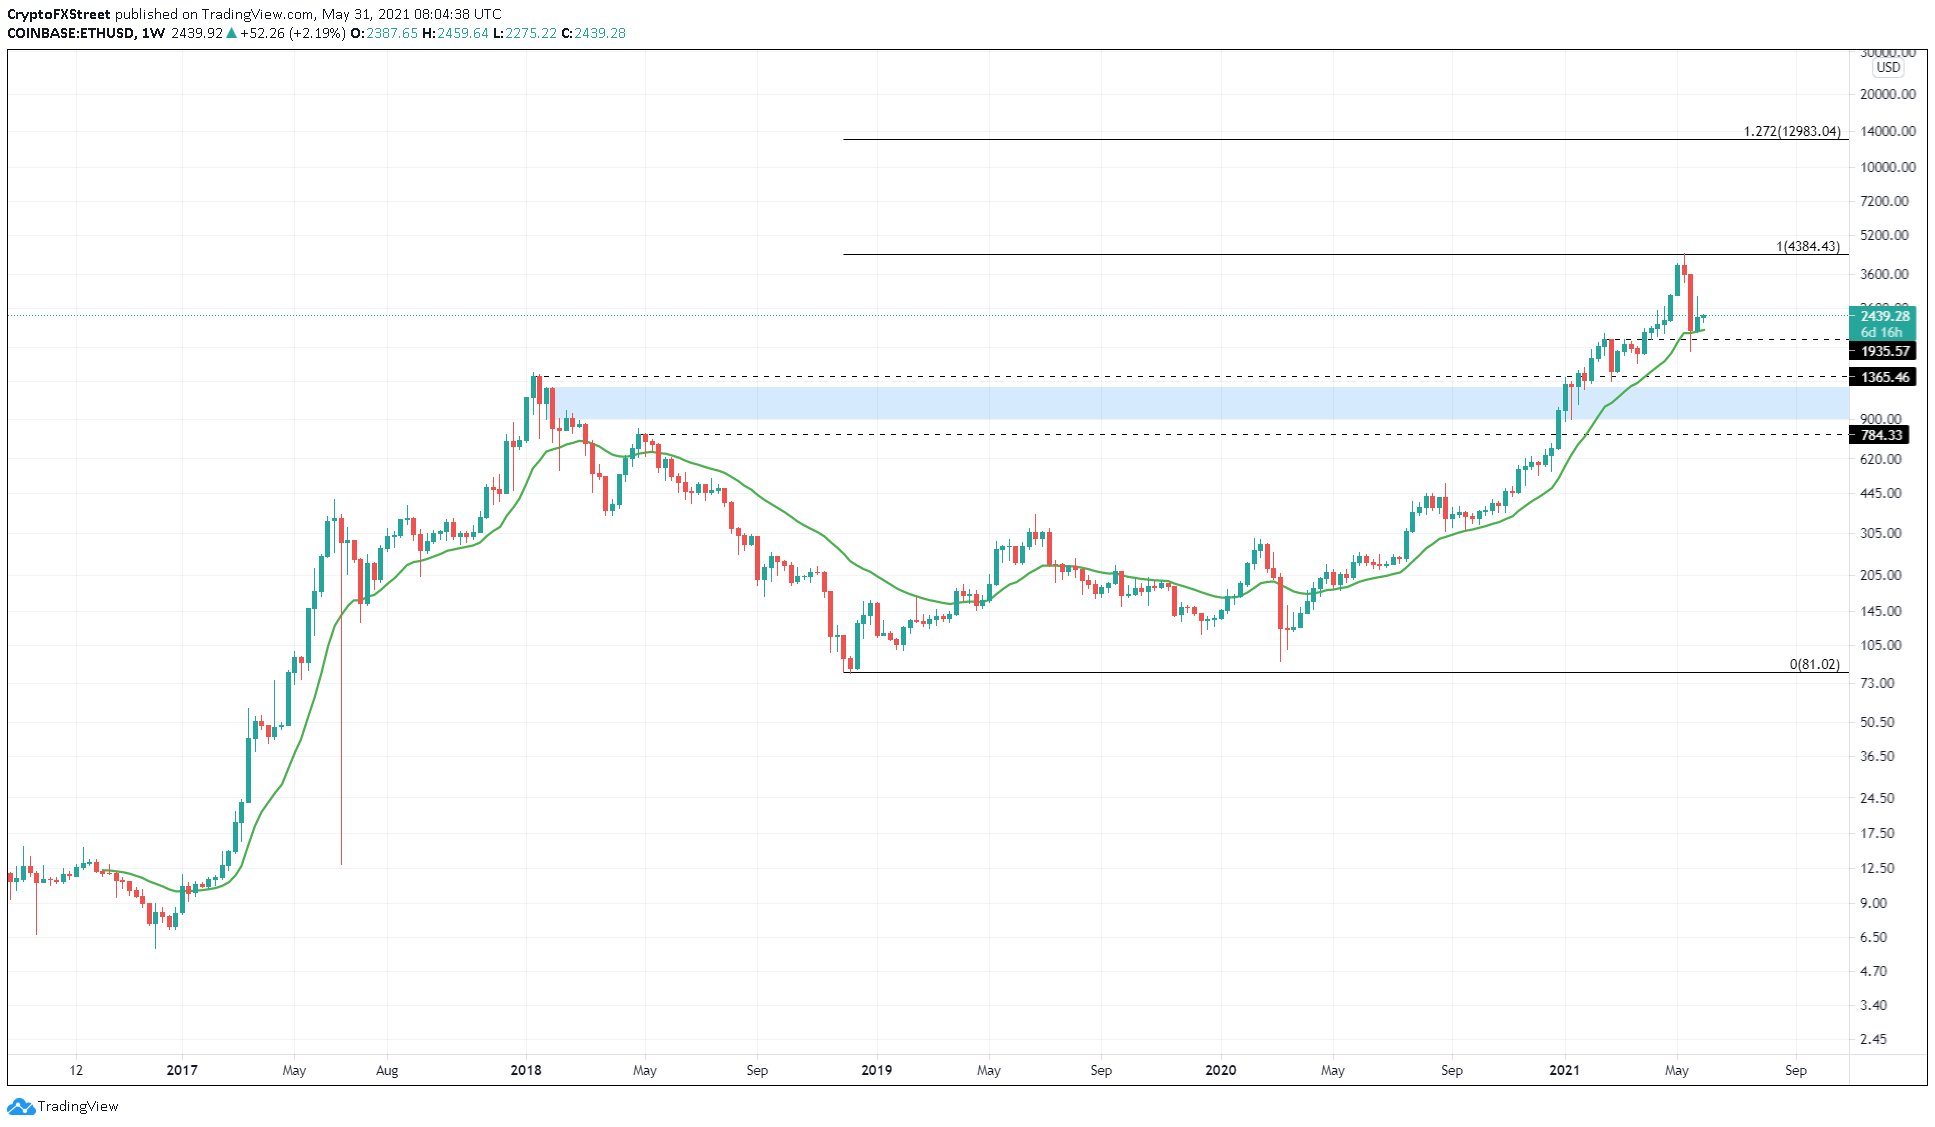
ETH/USD 1-week chart
Considering the bearish outlook on Bitcoin price and Ethereum’s high correlation with it, a flash crash in the flagship cryptocurrency that leads to a breakdown of $2,100 would end any optimism surrounding ETH.
The correlation of Ether to Bitcoin has increased from 0.42 to 0.83 over the past three months. This 97% increase in the correlation between the two cryptocurrencies indicates Ethereum is more likely to follow in Bitcoin’s footsteps.
In such a case, ETH could find support at $1,935. Failing to hold the said level could allow bears to send Ethereum crashing by 30% to $1,365. Under extremely bearish conditions, Ethereum price could retest the demand zone, ranging from $1,224 to $905.
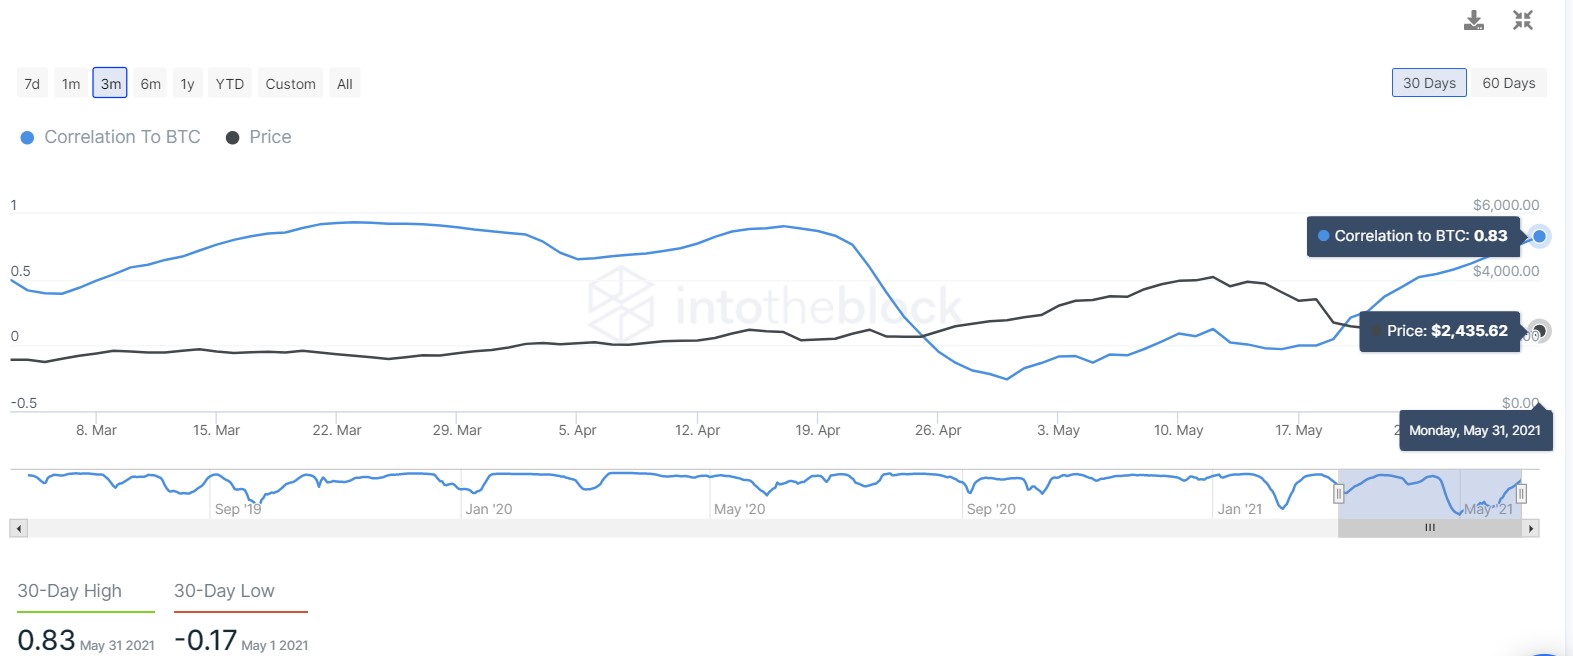
ETH BTC correlation chart
Supporting the bearish outlook is the 365-day Market Value to Realized Value (MVRV) model from Santiment. This fundamental index measures the profit/loss of investors who purchased ETH in the past year.
From May 11 to date, this metric has slid from 120% to 57%, where it currently stands. The decline indicates that the number of investors who were in profit have reduced due to the recent market crash.
Since a large percentage of investors remain in profit, there is a high chance these participants might book profits now than wait and incur losses. Such a move would add selling pressure, pushing Ethereum price lower.
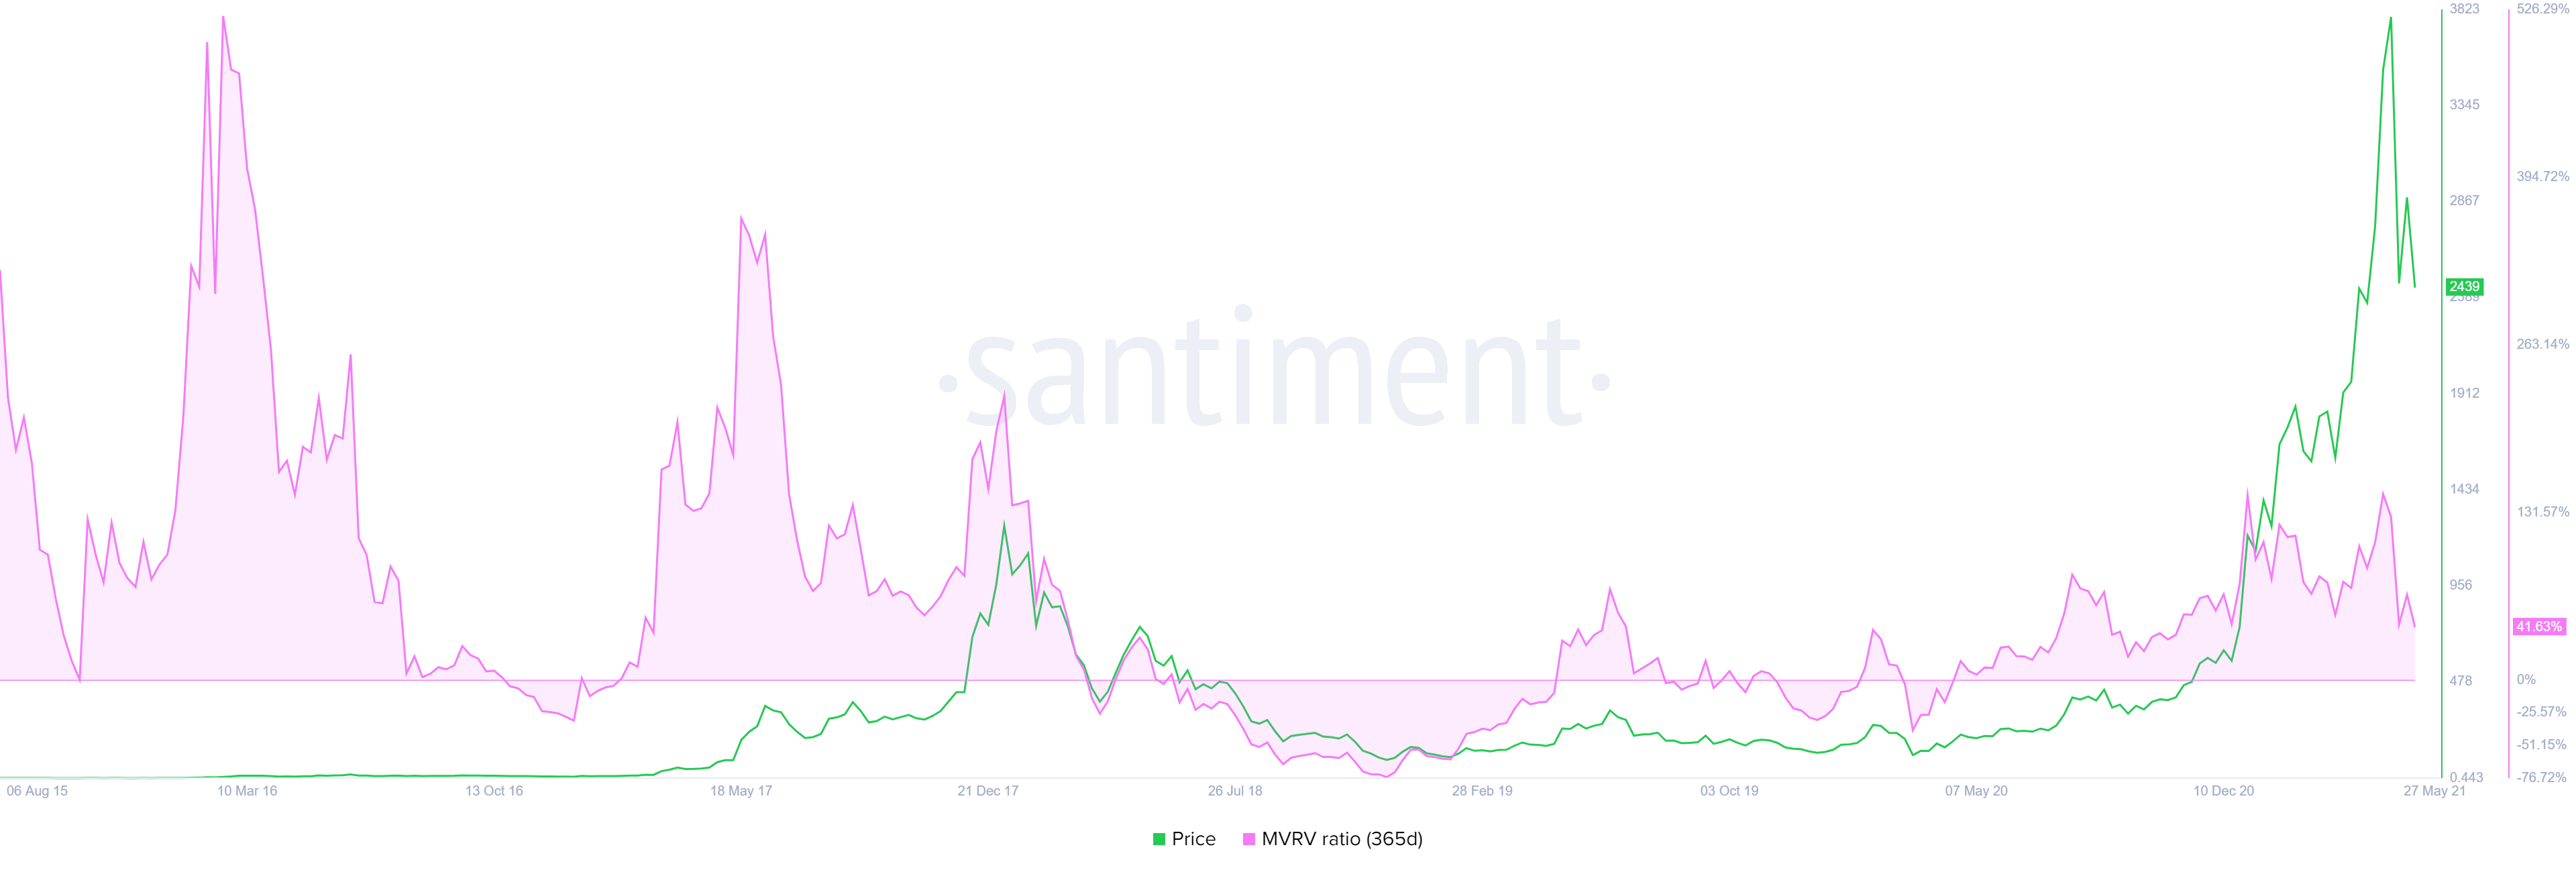
ETH 365-day MVRV chart
Adding a tailwind to the drop is IntoTheBlock’s “All-time highers and lowers” metric, which can be used to identify the current state of the ETH holders.
This model tracks the investors of market participants who purchased ETH and if they did so within 20% of the token’s all-time low or all-time high relative to the current Ethereum price.
The number of ‘all-time highers’ has increased from 382,000 to 1,300,000 since 2021. This 240% appreciation indicates that a large populace of investors that purchase ETH did so due to FOMO and are more inclined to sell under duress.
Further supporting a downtrend is the decrease in the all-time lowers from 3,960 to 3,840 addresses, suggesting that these addresses are booking profit.
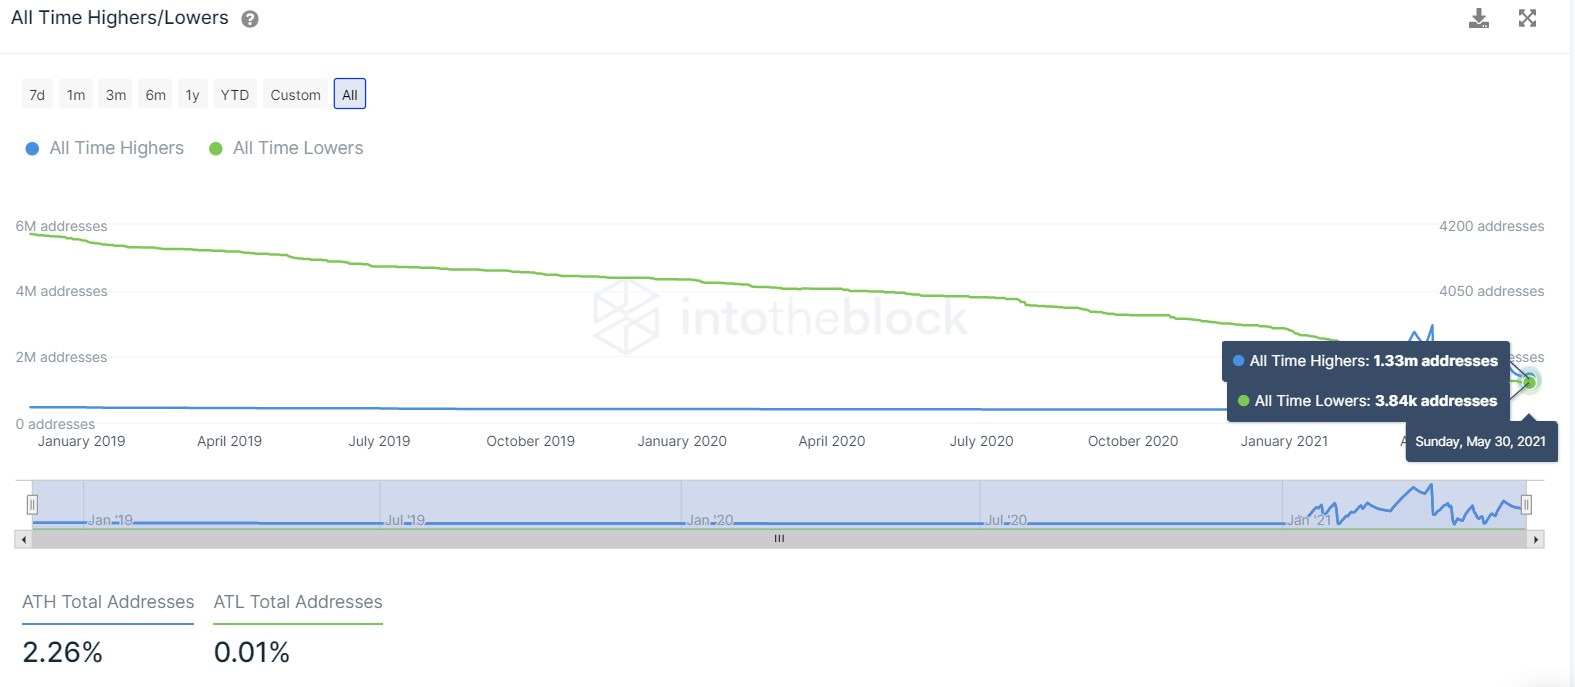
ETH all-time highers/lowers chart
Long-term outlook remains bullish
While the pessimistic scenario seems palpable and possible, investors need to account for the upcoming London hardfork and, most importantly, the Ethereum Improvement Proposal (EIP) 1559 that comes with it.
As the ETH tokens locked in ETH 2.0 contract hit 5.2 million, worth roughly $13 billion (at $2,500), investors need to understand that the EIP-1559 will bring a major facelift to the Ethereum blockchain’s fees and token issuance model.
The fees users pay to transact on the Ethereum blockchain are highly varying. But the newly introduced proposal, set to be included during the launch of the London hard fork in July, will reduce the arbitrary nature of transacting on the network.
The EIP will do so by splitting transaction fees into base fees and tips and burning the former.
If the usage is higher than the daily block issuance, it would effectively make Ethereum token deflationary, tackling a primary point of criticism for Ether. This model will benefit the investors and also reduce the congestion issue that generally plagues ETH.
Over time, the values from EIP-1559 will accrue and create an incentive to hold/stake ETH, thus increasing its fundamental value.
Moreover, the amount of Ethereum held on exchanges continues to plummet despite the recent flash crash. In fact, the 7-day average of the ETH held on centralized entities dropped from 13.9 million to $13.1 million since May 1.
This 5.75% decrease over the past month indicates the strong holders’ numbers far outweighs that of the panic-sellers, signaling that a large portion of investors are optimistic about Ethereum price performance in the near future
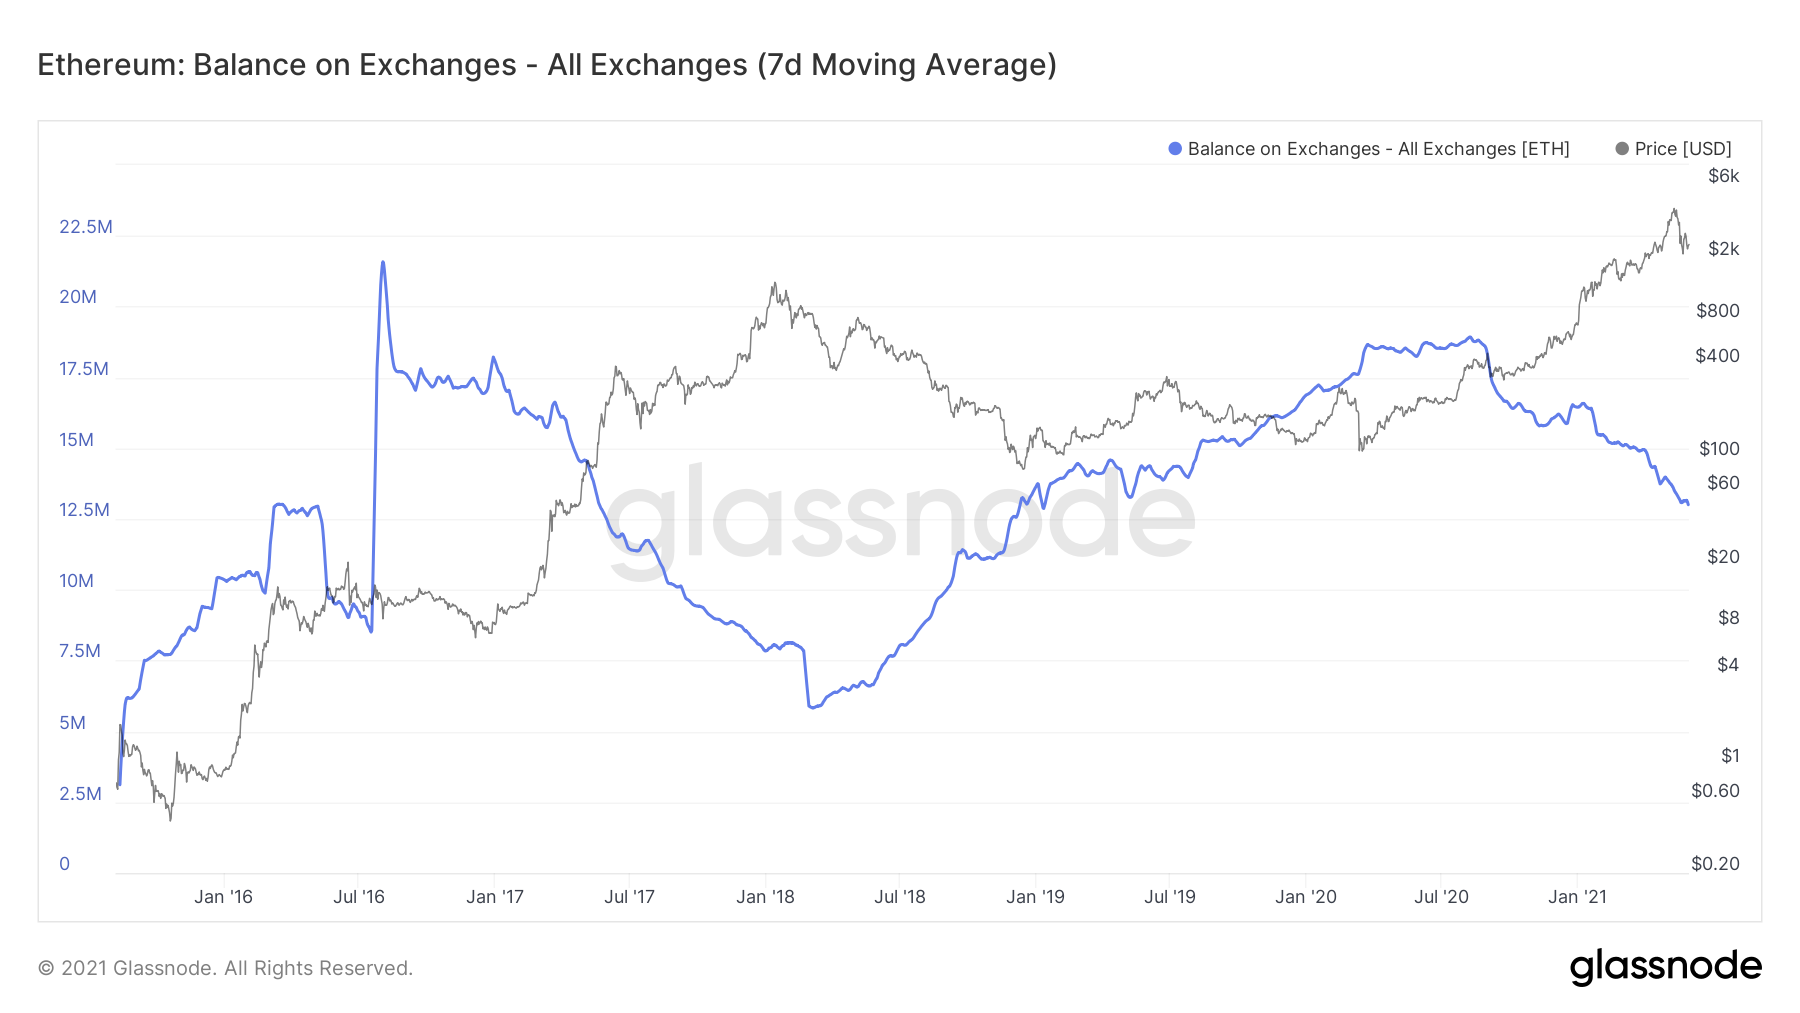
ETH held on exchanges chart
Despite the likely correction detailed above, Ethereum price has a legitimate case of making a comeback later. A decisive close above the previous week’s open at $3,590 will trigger a new uptrend.
In that case, the buying pressure could propel ETH to retest the all-time high at $4,384.43. Considering the strong fundamentals of Ethereum, its market value could appreciate 195% to tag a new all-time high at $13,983, coinciding with the 127.2% Fibonacci extension level.


