
- TRON price consolidates within a massive pennant, hinting at a 72% breakout.
- Although TRX triggered a bearish breakout on June 12, things have returned to normal, giving bulls another chance.
- A three-day candlestick close below $0.055 will catalyze a 72% crash to $0.016.
TRON price is coiling up between two significant trend lines since February 2021. This massive consolidation almost resolved to the downside but a quick recovery has provided the bulls with another chance at a bullish breakout.
TRON price prepares for humungous gains
TRON price has produced three distinctive lower highs since April 13, 2021, and four higher lows since February 18, 2021. These swing points can be connected using trend lines to reveal a symmetrical triangle formation.
This technical setup forecasts a 72% move, obtained by measuring the distance between the first swing high and swing low. However, this formation does not have a directional bias. Only after a successful breakout would the direction be determined.
On June 12, TRON price crashed below the lower trend line and produced a three-day candlestick close, signaling a bearish breakout. However, a quick recovery above $0.055 and the lower trend line halted the downtrend.
If this bullish momentum continues, TRON price is likely to tag the upper trend line of the symmetrical triangle, coinciding with the resistance barrier at $0.081. A three-day candlestick close above this level will reveal a target of $0.140, obtained by adding the 72% measure to the breakout point at $0.081.
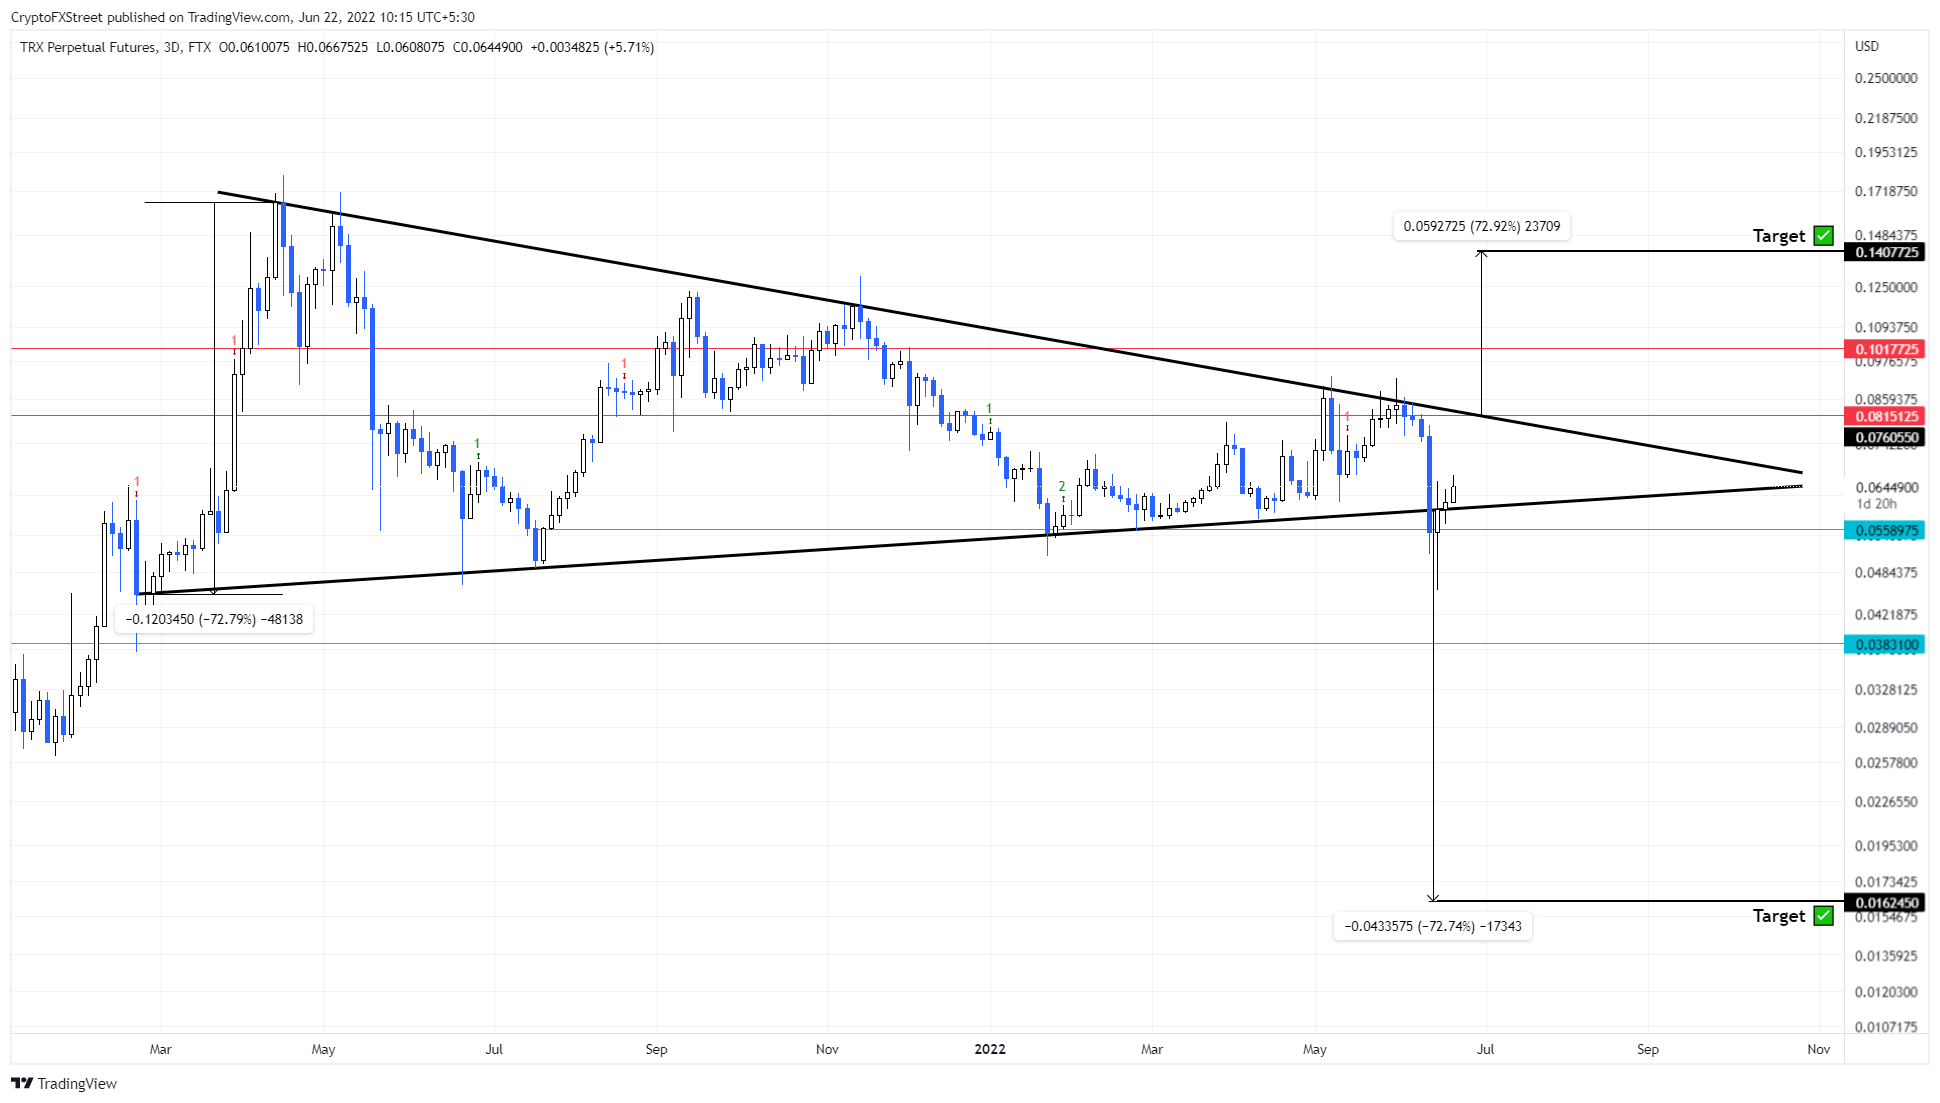
TRON/USDT 3-day chart
Regardless of the bullish momentum, if TRON price produces a three-day candlestick close below $0.055, it will signal a bearish breakout. In such a case, the symmetrical triangle pattern forecasts a 72% crash to $0.016.
The resulting move will likely face some slowdown around the $0.038 support floor.


