
- XRP price is locked in a downtrend as a descending parallel channel pattern has emerged.
- Ripple could be at risk of a 14% decline toward the lower boundary of the prevailing chart pattern if a key level fails to hold.
- Key support is at $1.10, where multiple technical indicators emerge as a foothold for XRP price.
XRP price is on the edge of decline if it fails to rise above a critical resistance level, putting any chance of recovery in jeopardy. Ripple must also hold above its last line of defense to avoid dropping lower toward $1.
XRP price sealed in tight range
XRP price has been trapped within a descending parallel channel on the 12-hour chart and is at the cusp of falling further if the last foothold fails to hold. The prevailing chart pattern dictates a bearish bias on Ripple, resulting in the failed attempts of the token climbing higher.
The Arms Index (TRIN), which gauges overall market sentiment, suggests that there are currently more sellers than buyers in the market, as it flashed the reading of 1.29.
XRP price is holding onto its last line of defense at $1.10, where the 21 twelve-hour Simple Moving Average (SMA), 50 twelve-hour SMA and the ascending support trend line that formed since July 20 meet.
Failing to sustain trading above the aforementioned level of support could mean trouble for the bulls, as Ripple would be susceptible to further decline, dropping toward $1.06 next, at the 38.2% Fibonacci retracement level, then toward the 100 twelve-hour SMA at $1.05, before eventually tagging the middle boundary of the governing technical pattern at $1.04.
An increase in selling pressure could see XRP price plunge toward the 200 twelve-hour SMA at $1.01, before eventually tagging the downside trend line of the parallel channel at $0.96.
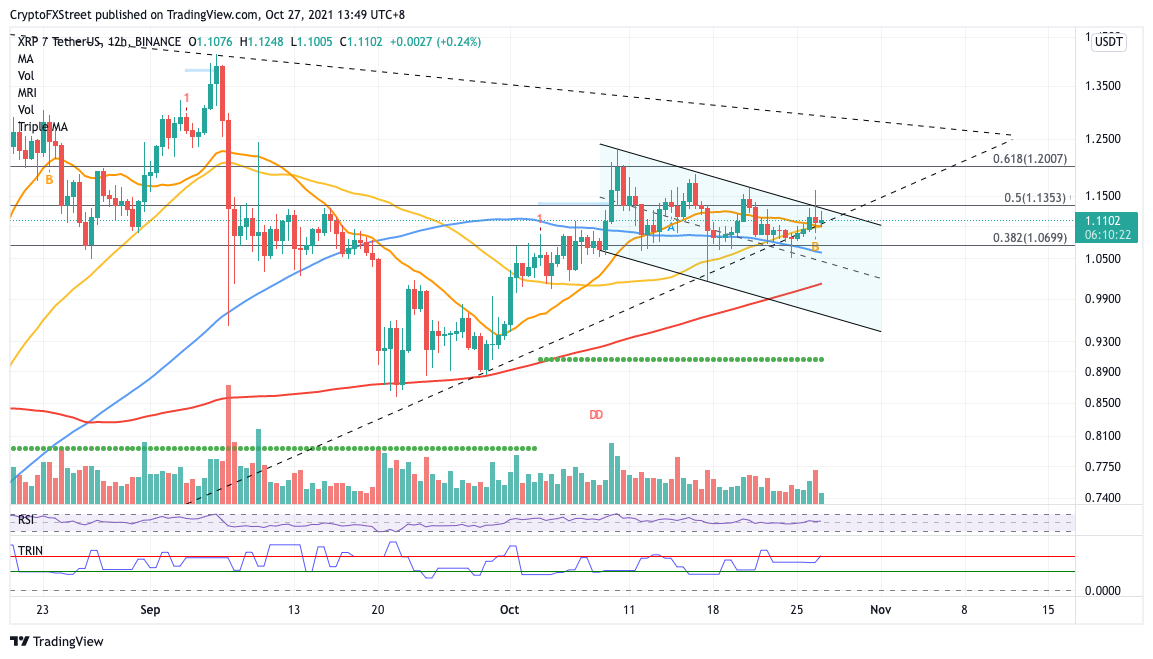
XRP/USDT 12-hour chart
However, if XRP price manages to hold above $1.10, Ripple could face resistance immediately at the upper boundary of the prevailing chart pattern at $1.12. An additional hurdle may appear at the 50% Fibonacci retracement level at $1.13.
The bulls may need to be patient for an uptrend, as further obstacles will emerge at the October 26 high at $1.16, then at the October 16 high at $1.18, before confronting the 61.8% Fibonacci retracement level at $1.20.
Until XRP price slices above the upside trend line of the governing technical pattern, a recovery awaits.


