

The US Dollar is one of the trending currencies of 2023. This is because of the various rate hikes by the US Federal Reserve in 2022 and 2023. Other central banks have also been in the news, but less than the Fed. This scenario has imparted significant price moves on the EUR/USD and other dollar-denominated pairs.
Today, we present a strategy capable of trading the trend on the USD-pairs such as the EUR/USD, GBP/USD and Gold (XAU/USD), specifically on short-term charts that mirror intraday price moves. Combining a trend-following indicator and an oscillator that detects price extremes makes this strategy suitable for trading the start of a new trend brought on by trend reversals.
What indicators are used?
This strategy requires the use of two custom indicators. These will be available for download when you click the link below the article. These indicators are:
- PW Trend indicator
- i-Sadukey indicator
The two indicators comprise the strategy's elements: a trend-following component and a momentum component.
The PW trend indicator is the momentum indicator. This indicator has a vertical range that extends from 0 to 31. Since the vertical range does not extend up to 100 as with conventional momentum indicators, the ranges that form the oversold and overbought market areas are also different. The oversold area in the PW trend indicator window is between 0 and 4, leaving the area between 27 and 31 as the overbought price extreme area.
The trend indicator is the so-called i-Sadukey indicator. The indicator is colour-coded and changes colour whenever the trend of the asset changes. It would be best if you watched for colour changes in this indicator when the asset comes out of the oversold price area and from blue to red when the trend reverses downwards from the overbought zone.
The strategy will explain how these two indicators are combined to produce a tradable signal.
Time Frame
This strategy is mostly used in day trading. As such, it works best on short-term time frames such as the 15-minute chart. If you have used this chart lately, you will discover that there are loads of opportunities that this chart has presented in recent times for intraday trades.
The strategy description will be based on one of these assets and the 15-minute time frame.
Trading the Strategy
The trade aims to combine the colour change of the i-Sadukey indicator and the emergence of the PW trend indicator from the oversold or overbought price levels. As with all momentum indicators, the best signals are obtained as follows:
- When the indicator has been in the price extreme region for some time.
- When the indicator is close to the zero mark (oversold) or the 31 mark (overbought).
- When the indicator line forms peaks and troughs, these can form the basis of detecting a definable divergence.
1) Long Trade
From the conditions in the last paragraph, you can set up a long trade, as shown in the example below. Here, the indicator's line has shown two quick dips that allow for a divergence to be called from the price. This divergence of the PW Trend indicator is expected to correct upwards. So trade as follows:
- The PW trend indicator is in the oversold area.
- The i_Sadukey_V1 indicator has changed colour from yellow to blue, indicating a change in trend.
- Allow the candle to close, then take a BUY trade at the opening of the next candle.
- Set the Take Profit target where a prior resistance was seen.
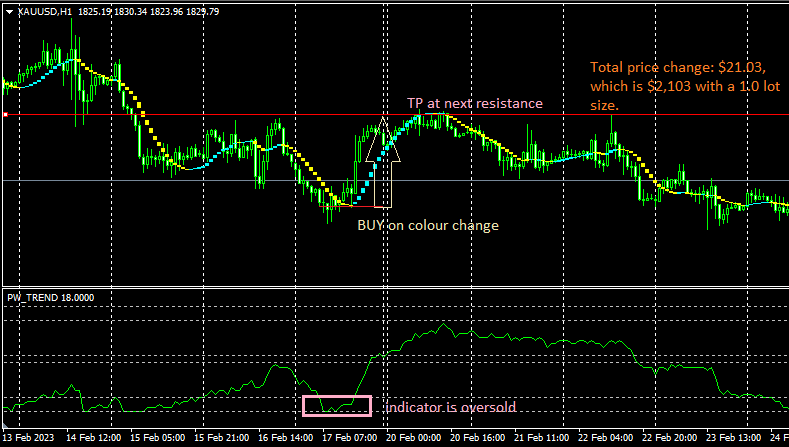
Long Entry Setup
The snapshot above shows that the PW trend indicator in the oversold region and the i-Sadukey indicator had changed colour from yellow to blue, signalling a trend change.
If you are trading an asset such as gold, where the price moves are in points and not pips, you do not need ambitious targets to make good profits. In the example above, the total price change from the entry to the potential exit point was equivalent to $21.03. For a 1.0 standard lot trade, this is a potential profit of $2,103.
To prevent a repaint of the indicator, please wait for the signal candle to close before entering the next candle after all parameters have been met.
The Stop Loss (SL) is set below the lows of the candles that immediately precede the entry candle. For the Take Profit (TP) targets, use a price level where a prior high has formed a resistance.
2) Short Trade
The short trade entry must follow one of the three parameters listed previously. In this example, the momentum indicator remains in the overbought area for some time, forming a divergence with the price action. The correction of this divergence would put the trade in profit if the entry was set according to the following standards:
- PW trend indicator is in the overbought zone.
- The i_Sadukey_V1 indicator has changed colour from blue to yellow.
Allow the candle to close, then take a BUY trade at the opening of the next candle. This snapshot shows what the short trade setup looks like.
Short Entry Setup
This snapshot shows the PW trend indicator in the oversold region for a considerable length of time. At the same time, price continues to trend upwards even as the PW Trend indicator is no longer showing higher highs. This divergence will be corrected. Your job as the trader is to trade these two confluent setups by going short at the open of the candle following the colour change in the i-Sadukey indicator.
Once more, you are encouraged not to set targets that are too ambitious. If you trade gold as shown in this setup, a relatively small price move can lead to some good gains. Here, the price move was a total of $7.20, which delivers $720 if you are trading a standard lot of 1.0.
Set your Stop Loss (SL) above the peaks of the candles that precede the colour change. Use a previous support as the initial target for your Take Profit (TP) setting.
Indicators download link (google drive): PW Trend, i-Sadukey