

The Master Trend strategy is a trend-following system which presents the trading opportunities that occur within the context of a trend. Rather than trying to detect such opportunities within a trend manually, the strategy uses two indicators that can filter themselves out to provide you with suitable trading signals.
The strategy is not just about trading entries within a trend. It also uses the Average True Range to indicate the potential extent of the price move, so you do not set entries that are not achievable and which could expose your positions to a retracement that wipes off unrealized profits. If you are also a trader in the prediction options market, the signals generated by this strategy may help you successfully trade the Call/Put trades. However, forex and CFD traders need to know their entry and exit points with a reasonable range to get good profits.
Indicators Used and Chart Setup
The strategy requires the use of two customized indicators that have been programmed to work on the MT4 platform only. They are not compatible with the MT5. These indicators are:
- Trendline indicator
- Trend Direction indicator
Long and short trades are used to exploit two of the three trends that exist in the financial markets. The uptrend is formed by higher highs and higher lows, while lower lows and lower highs form the downtrend. How about having an indicator which tells you when prices are trending upwards or downwards? This is what the Trendline Indicator brings to the table. The indicator is simply a moving-average line that changes from one colour to another in response to a change in asset direction. The default colours are blue and red, with the blue-red colour change indicative of a downtrend and the red-blue change suggestive of an asset that is trending upwards. When you see a blue indicator for this indicator, you know the asset is in an uptrend and you should be looking for a long trade. Conversely, a red colour indicates that prices are trending downwards and you should be looking to trade short.
Once you decide on the direction of your trade, the next step is to find the actual entry point for the trade. This is provided by the Trend Direction indicator in the form of colour-coded arrow signals, with the arrow pointing in the direction of the trade. In other words, the colour and direction of the arrow indicate the direction of the trend and hence the direction of the trade. Therefore, a red-coloured arrow that faces south indicates a selling opportunity, and a blue-coloured arrow facing upwards suggests that an opportunity to go long presents itself.
But this is not all there is to it. The Trend Direction indicator also comes with a dotted line. This dotted line is the Average True Range, which indicates how far any potential moves in the asset would go before the move is exhausted. This helps to know when to exit the trade.
Charts Used
The short-term charts show a lot of choppiness and do not present a true picture of the trend. It is for this reason that the indicators have to be applied to a 4-hour chart or the daily chart. Do not use it on the 5-minute, 15-minute or 1-hour charts. Here is how both indicators look on a 4-hour chart.
Trading the Strategy
What are the parameters that need to be fulfilled to call this strategy into existence? Let us look at the entry setups.
1) Long entry
The long entry parameters are as follows:
- Trendline indicator must be blue-coloured.
- Trend Direction indicator must show a blue-coloured arrow pointing upwards.
- The Trendline indicator line must be above the Trend Direction’s purple-colored ATR line.
The snapshot below indicates the conditions that must be fulfilled for the long trade to become valid.
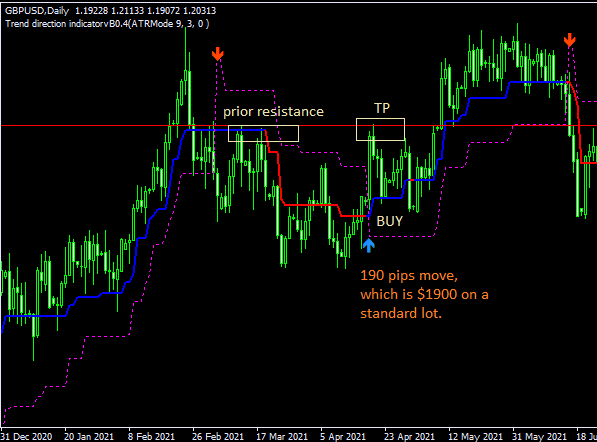
Long Entry Setup
The chart above presents one long trade setup, which delivered 190 pips on the GBP/USD chart. This move retraced and eventually continued much higher. But since we cannot predict market behaviour too far into the future, it is always best to take what the market offers and move with it rather than to take extended risks.
In setting the stop loss and profit targets, you must use the ATR line as the benchmark for the stop loss. A few pips below the ATR line will suffice. For the Take Profit (TP) targets, you must use a prior resistance as indicated in the snapshot. You may also decide to close the trade manually if there is a contrary signal, such as a down arrow from the Trend Direction indicator.
2) Short Entry
A valid short trade setup should show the following:
- The Trendline indicator is now red-coloured and appears above the Average True Range line of the Trend Direction indicator.
- The Trend Direction indicator appears as a red-coloured arrow pointing to the south.
Once these parameters are fulfilled, take the trade on the opening of the next candle. The snapshot below shows two instances where the trade entry was valid and one instance where the trade parameters were not met, resulting in what would have been an invalid entry despite the price moving in the required direction.
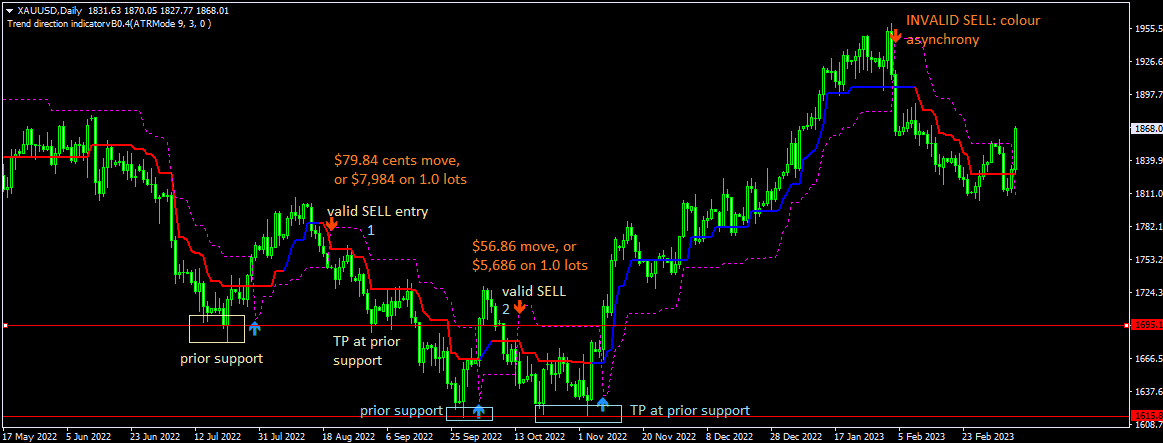
Short Entry Setup
The first instance shows a situation where the parameters were met, resulting in the price move of $79.84 in the XAU/USD pair. If the trader uses 1.0 lots (1 standard lot) as the trade size, this would deliver $10 per pip, and the earnings from this trade would hit $7,984. A similar setup occurred soon after, resulting in a price move of $56.86. In both instances, the profit target was the previous price support. You may also close the trade manually if a contrarian signal appears.
In setting the stop loss (SL), use the Average True Range line as indicated for the long trade to set your stop loss. You should set the stop loss above the dotted ATR line.
Indicators download link (google drive): Trendline, Trend Direction