

The strategy combines the use of an oscillator indicator and the pivot points. Itis designed for use in the forex market, and it will work across various time frames. However, the one hour chart is preferred because that is the default time frame on which the daily pivot points are generated.
Indicators needed
You will need the following to execute this strategy.
- You will need an MT4 or MT5 chart.
- You need to download any of the various versions of the Automatic pivot point calculator from the MQL Community website. These are all available for free.
- The Stochastics histogram indicator. The Stochastics histogram is actually a version of the Relative Strength Index indicator to which histogram bars have been added. Again, you can download it from the MQL Community website.
The strategy
One way that oscillator indicators are used in the forex market is by way of what is known as a divergence. A divergence is a situation where the oscillator’s highs/lows are pointing in the opposite direction from those of the price action. In other words, progressively higher lows or progressively lower highs that occur in the oscillator when the price action is showing either lower-lows or higher-highs respectively, is a divergence. Oscillators are leading indicators; their direction and movement precedes those of the price. Therefore, it is expected that the direction that has first been assumed by the indicator will eventually be displayed by the asset’s price. So what is traded in the divergence is the correction of price to move in tandem with the oscillator.
In this strategy, the divergence is combined with something else: price action at the pivot points. If the divergence is accompanied by a corresponding price action at a pivot point, in a direction that supports the correction of the divergence, the trade is taken.
Pivot points have seven levels: three support pivots (S1, S2 and S3), a central pivot and three resistance pivots (R1, R2, R3). There is some sort of misnomer in the naming of the pivots. A support pivot can equally act as a resistance, which you will see if price heading upwards from S2 is rejected at S1, or if price coming up from S3 is rejected at S2. Similarly, a resistance pivot will act as a support if for instance, price heading down from R2 is unable to break R1. R1 in this manner has acted as a support. The central pivot can also be a support or resistance, if price heading down or moving up respectively, fails to break the central pivot line.
So how are all these used to come up with tradable forex signals?
Long trade
A long trade setup will involve seeing a bullish divergence, and an upward bounce of price off a pivot, irrespective of what that pivot point is. In other words, we need to see a situation where:
- The Stochastics histogram is showing progressively higher lows when the price is showing progressively lower lows.
- Price is bouncing off a pivot point, which would occur if price had come down to the pivot without being able to close below it.
Let us look at this chart below, which is a 1-hour chart of the EUR/USD pair.
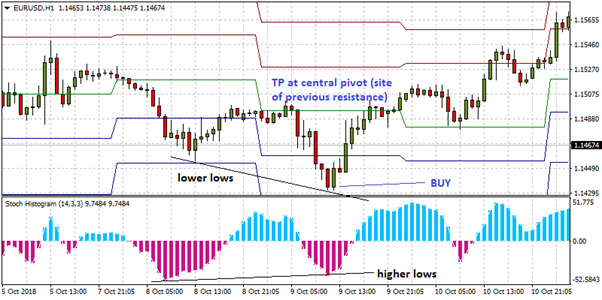
A dynamic pivot point calculator is used. This automatically recalculates itself every day and also displays past pivot points for a trader’s reference. We see the purple histogram bars showing higher lows, and the price showing lower lows. Using a trendline to plot the lows of the indicator and price makes this picture a lot clearer. The price had approached the S2 pivot from above and failed to break below it, thus forming the 2nd price low. A long trade is initiated at the open of the new candle.
The exit targets are set as follows:
- Protective stop (Stop Loss or SL) is set below the pivot point that formed the 2nd price low.
- The Take Profit (TP) is set initially at the next pivot point above the entry point. In this instance, price broke straight through the S1 pivot and stalled at the green-coloured central pivot line, which incidentally is an area where price had found resistance in the past.
Short trade
To setup a short trade, we need to see a negative divergence, and a price rejection with a downward move off a pivot, irrespective of what that pivot point is. In other words, we need to see a situation where:
- The Stochastics histogram is showing progressively lower highs when the price is showing progressively higher highs.
- Price is rejected at a pivot point, which would occur if price coming from below, hits a pivot point above without closing above it.
Let us look at this chart below, which is a 1-hour chart of Bitcoin. Many forex brokers now offer crypto CFDs on their platforms, so do not be surprised at the chart example used.
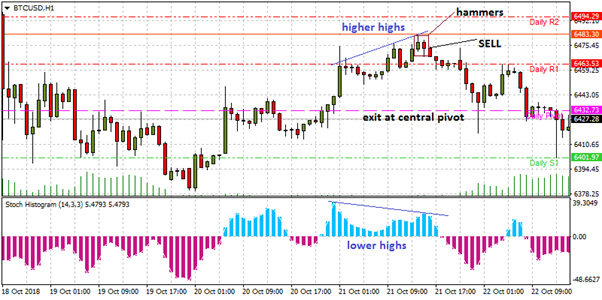
Here, we see the divergence, and most importantly, the formation of two pinbars at a monthly pivot line. Sometimes, monthly pivot lines will form in between daily pivots. These are actually stronger than daily pivots and when they are seen, they take pre-eminence over the daily pivots. The entry is made at the open of the new candle following the 1st or 2nd pinbar, and the trade is allowed to move down to the next pivot below. In this example, price was bearish enough to keep pushing to the purple coloured central pivot.
The exit targets are set as follows:
- Protective stop (Stop Loss or SL) is set above the pivot point on which the 2nd price high formed.
- The Take Profit (TP) is set initially at the next pivot point below the entry price. In this instance, price broke below the R1 pivot and hit the purple-coloured central pivot line.
A note on exiting positions
Commonly, price action may be strong enough to burst through the pivots used initially as Take Profit points, as seen in the examples above. A way to capture extra profits is by using a Trailing Stop as opposed to using a static TP price target. The Trailing Stop is initiated when the position is in profit territory. It will chase the price as it advances in the direction of the trader’s position, but will stop moving if the trade starts to reverse against the position. In this manner, you can protect your unrealized profits, and still aim to capture more if the price action pushes through the initial pivot profit target.