

Pivot points are key areas of support and resistance which can be plotted on the charts on a daily, weekly or monthly basis. The daily pivot points are the ones described in this strategy, and are derived from the high, low and closing price of the previous day’s price action.
There are lots of sources of the automatic pivot point calculator, which is a custom MT4 indicator that can plot the pivot points and update them every new trading day. This takes away the stress of having to calculate the pivot point values and manually plot them on the charts.
Chart Setup
The MT4 or MT5 charts can be used in setting up the pivot point indicator. Two variations of this indicator exist. There is one which retains the trace of previous pivot points, and there is the version which does not. No one is better than the other; it depends on the trader’s preference. The chart setup is therefore as follows:
- Indicators: Daily pivot point calculator
- Time Frame: 1 hour exclusively
The strategy can be used in any trading session.
The Strategy
The pivot point indicator plots the following pivot points:
- 3 support pivots (S1, S2 and S3)
- A central pivot (also known as daily pivot)
- 3 resistance pivots (R1, R2 and R3).
In truth, any of the pivots can serve as support or resistance, depending on whether prices are coming from above or below. Therefore, price coming from the S3 area will find S2 and S1 as a resistance, while price coming down from the R1 area will find the central pivot as the first support to test.
We would be looking for price to find support or resistance at a pivot point, combined with a candlestick pattern or other technical basis to support a trade in the direction of the price rejection or support at a pivot point.
Long trade
Here, the trader is aiming to trade a bounce of price action off a pivot point. In this case, the price action should be coming from above, find support at a pivot point, and then trade upwards to provide profits for the position. This is how the trade is setup:
- a) Apply the pivot point calculator to the chart at the beginning of the week. Each new day, simply refresh it by clicking to the daily chart and back to the 1-hour chart. The indicator will automatically plot the new levels for the day.
- b) Allow the price action to come from above, and find support at a pivot point. In other words, the candle must touch the pivot but fail to close below it, indicating a no-breakout situation. If the candle has closed below the pivot, this invalidates the trade setup (see left-side of chart for this illustration).
- c) If candle bounces successfully off the pivot, then you can open the long trade position at the open of the next candle.
- d) The profit target is naturally going to be set initially at the pivot point located immediately above the entry pivot. The stop loss can be set below the lowest price of the candles preceding the trade entry.
The chart below showcases a long trade setup, including a condition where the trade entry is invalidated by a candle closing below the pivot.
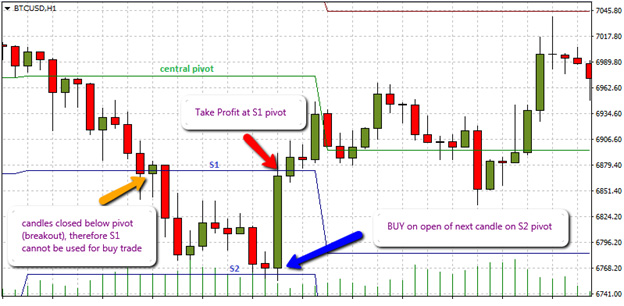
In this example, the S2 pivot is tested twice and held firm, prompting the trade entry at the open of the next candle. Earlier on, a setup occurred, which did not favour an entry on the S1 pivot. Subsequent price action goes to confirm that ignoring the temptation to enter long at that point would have been a good idea as price kept going south.
The proper entry worked out, with price hitting the target (S1 pivot) in one hour.
Short Trade
Trading short requires trading a rejection of a candle at a pivot point, in which case price has to come from below. This is how the trade is setup:
- a) Apply the pivot point calculator to the chart at the beginning of the week, refreshing it as described above.
- b) Allow the price action to come from below, hit a pivot and be rejected at that pivot. In other words, the candle must touch the pivot but fail to close above it, indicating a no-breakout situation. If the candle has closed above the pivot, the setup is invalidated.
- c) If candle is successfully rejected at the pivot above, then you can go short at the open of the next candle.
- d) The profit target is naturally going to be set initially at the pivot point located immediately below the entry pivot. The stop loss can be set above the highest price of the candles preceding the trade entry.
The chart below showcases a short trade setup.
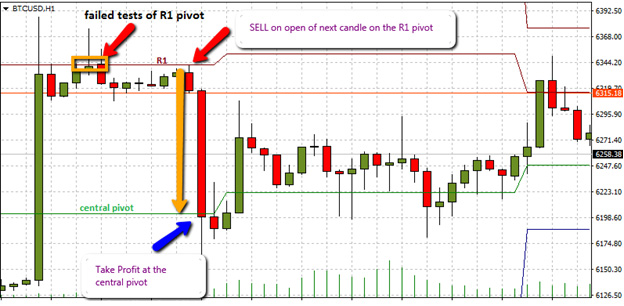
In this example, the R1 pivot acted as the resistance pivot and a trade was easily setup with profitability at the R1 pivot. The profit target was the central pivot line.
Points to Note
Both examples featured the use of a dynamic pivot point calculator, which traces new pivot points automatically without the need to refresh the page. This particular pivot point calculator is named “Auto Pivot Plotter”. It is free and you can check online for the latest version.
The advantage of this particular indicator is that sometimes, pivot points may cluster around the same price levels for a few days. A look at the chart history will show what the relevant pivots have served as support/resistance to price action. This information may become relevant and may support whatever entries you wish to make at the present time.
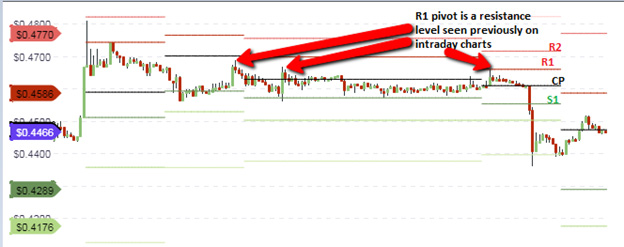
Here, we can see that the R1 pivot from which prices began to head downwards was at the same price level as the central pivot (which also resisted upside price movement) a few days before. So use a dynamic pivot calculator which displays historical pivot points for referencing purposes when searching for current trade opportunities.