

The strategy discussed today works best on the 1 hour chart and features the use of the Parabolic SAR indicator. As such, it is suitable for intraday trading, and can be used on any forex assets.
Tools required
This strategy will require the use of the following tools:
- a) The chart to be used is the 1-hour chart as mentioned earlier.
- b) The indicators that will be used are the Parabolic SAR indicator and the Stochastics oscillator, which will be modified by adding a line at the midway point in the indicator window. All other settings will be left intact.
For clarity, the charts used should be those of the MT4 or MT5, or from Tradingview.com.
About The Strategy
This strategy is essentially a trend-change strategy. The Parabolic SAR indicator is a trend-following indicator, which is combined with the Stochastics oscillator functioning as a momentum indicator. Strategies that involve trend trading typically combine trend indicators and momentum indicators for filtering the signals. In this strategy, the Stochastics will be used to create a trend-change filter, in which case the cross of the indicator lines across each side of the midline at 50.0 is considered as the trade entry confirmation.
This strategy combines some element of multiple timeframe analysis. The daily and 4-hour charts are used to pick out a synchronous trend direction, and the signals on the 1-hour chart must correspond to the direction of the trend picked out by the daily and 4-hour charts, for the signals to be deemed valid.
So the entry is based on three parameters: – Direction of the trend on the daily, 4-hour and hourly charts. – The signals of the Parabolic SAR (i.e. position of the dots). – Whether or not the Stochastics lines have crossed the 50.0 mark, moving in the direction of the trend. The entry parameters on each side of the market divide are now examined in greater detail.
Long Entry
The long trade setup occurs when there is an uptrend on the daily and 4-hour charts, when the parabolic SAR is showing a Buy signal and the Stochastics oscillator crosses the 50.0 mark, coming from the downside.
So the trade to make is to BUY the asset when the following occurs:
- a) Price is trending upwards on the daily and 4 hour charts (see charts below).
- b) Parabolic SAR indicator dots are located below the price on the 1-hour chart.
- c) Stochastics lines have just crossed the 50.0 mark to the upside.
Once this setup is complete, the next step is to look for a valid entry price level. In the chart below, we see this provided by the break of the resistance trendline. The trade is therefore opened at the open price of the new candle following break of this trendline.
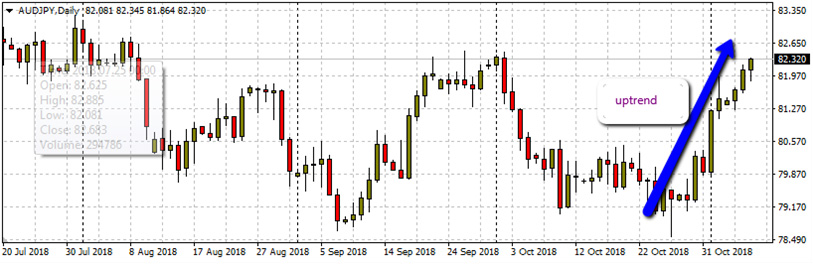
AUD/JPY Daily Chart Showing Uptrend

AUD/JPY 4-Hour Chart Showing Uptrend; Tallying with Daily Chart
On the daily and 4-hour charts, we can see that the price action is in an uptrend, and this means we have to look for a buy signal on the hourly chart. Below, the hourly chart shows the aspects of the BUY trade setup described above.
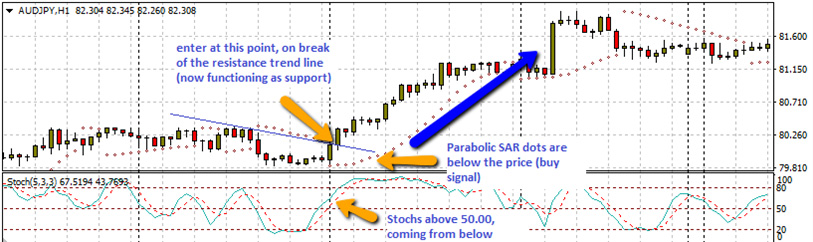
BUY Setup on the 1-hour Chart
The protection stop is set at a few pips below the broken resistance line, and the profit target is set at an area where price has found resistance above the entry level. The trader should target to make 3 pips profit for every 1 pip stop.
Short Entry
The short trade setup occurs when there is a downtrend on the daily and 4-hour charts, when the parabolic SAR is showing a Sell signal and the Stochastics oscillator crosses the 50.0 mark from above.
So the trade here is to SELL the asset when the following occurs:
- a) Price is trending downwards on the daily and 4 hour charts (see charts below).
- b) Parabolic SAR indicator dots are located above the price on the 1-hour chart.
- c) Stochastics lines have just crossed the 50.0 mark to the downside. If the line is coming from the downside and is rejected at the 50.0 mark, this is also good for a possible re-entry.
Once this setup is complete, the next step is to look for a valid entry price level. In the chart below, we see this provided by the break of the support trendline, enhanced by a hammer candle that closed below the trendline. The trade is therefore opened at the open price of the new candle following break of this trendline.
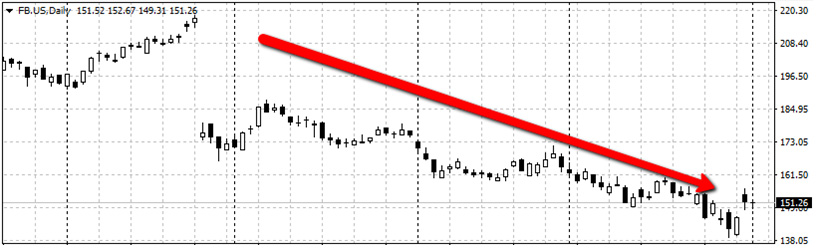
FB Daily Chart Showing Downtrend
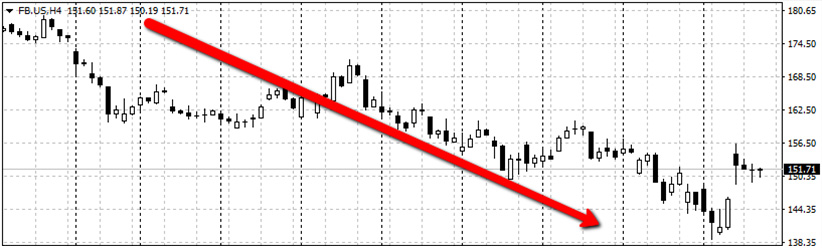
FB 4-Hour Chart Showing Downtrend; Tallying With Daily Chart
On the daily and 4-hour charts, we can see that the price action is in a downtrend, so a sell signal on the hourly chart must be sought by the trader. Below, the hourly chart shows the SELL trade setup described above.
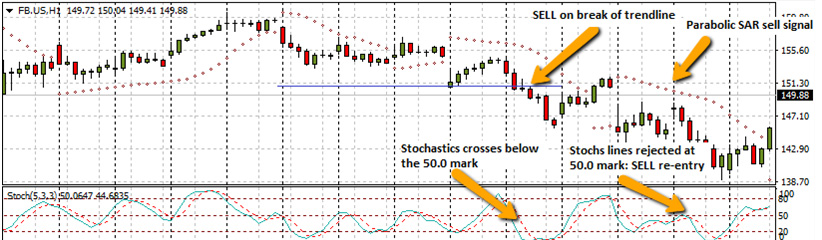
SELL Setup on Hourly Chart
The stop loss is set above the broken trendline, and the profit target is set at the next support level that is located below the entry point.
These strategies must be tested thoroughly, with emphasis placed on proper multi-time frame analysis.