

This strategy introduced in this article utilizes the Wolfe wave patterns, which were given to the trading world by William Wolfe, a trader who traded the S&P500 index. The strategy places a lot of emphasis on precision of entry and exit points for each trade and takes advantage of the wavy nature of the market.
Indicator
The indicator for this strategy is the Wolfe-wave indicator. However, many versions tend to repaint on the charts, thus producing inaccurate reference points. So using visual identification is the method that is preferred by the writer. The strategy can be used on the 1 hour, 4 hour and daily timeframe charts.
The Strategy
Bill Wolfe invented the Wolfe waves. Just like their name implies, Wolfe waves mimic the Elliot wave 1-2-3-4-5 pattern, and form within the context of rising and falling wedges. The continuation and retracement price action at the various reference points are the wave movements, which are used in detecting the subsequent trade entry and exit points on the pattern. The various reference points from 1 to 5 are explained below.
Point 1: Price wave patterns commence here and trace an upward wave to point 2 (bullish wave) or downwards to the same point (bearish wave).
Point 2: is the trough (bearish wave) or the peak (bullish wave) of the wave pattern. It is lower/higher than point 4 on the bearish/bullish wave patterns respectively.
Point 3: is a retracement from point 2, and is lower/higher than point 1 on the bearish/bullish wave.
Point 4: is the 2nd bottom/top from point 3, for the bearish or bullish wave respectively.
Point 5: represents a higher high (bearish wave) or a lower low (bullish wave) from point 4.
Expected point of arrival (EPA) is the target price for a trade based on the Wolfe wave, and it is a breakout price move opposite to the wedge pattern formed by points 1-2-3-4-5.
The apex of the wedge pattern is formed by the convergence of lines 1-3 and 2-4: this apex must be in the same vertical spot as the EPA. The apex can provide a timeline to the arrival of price at the EPA, and is thus known as the expected time of arrival (ETA).
Trading the Wolfe Wave Strategy
There are two entry points for trades done according to the Wolfe wave pattern. These are:
a) At point 5
b) At point of price break from wedge after price has taken off from point 5.
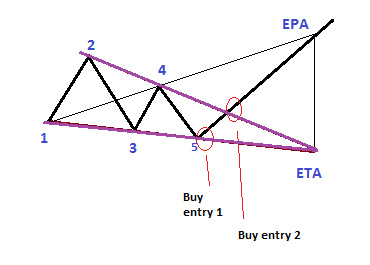
Buy entry and exit for Wolfe wave (bullish outcome)
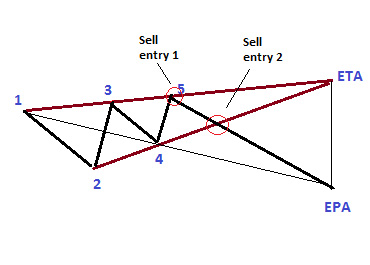
Sell entry and exit for Wolfe wave (bearish outcome)
The snapshots above show the trade entry points. The trade exit is at the EPA, and the ETA gives the trader an idea of when the exit point is to be reached.
Short trade setup
The short trade setup occurs within the context of the Wolfe wave formation within the rising wedge, with the final outcome being the drop in price from point 5 all the way down to the EPA. Price is expected to break below the rising wedge on its way from point 5 to the downside, and this is captured in the chart below.
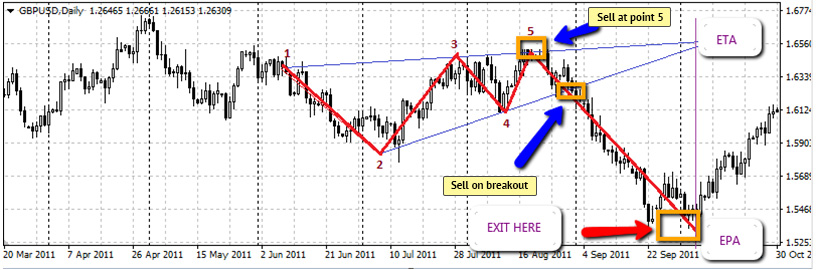
Short trade Wolfe Wave Setup on GBP/USD Daily Chart
The chart above indicates what a short trade setup would look like, with points 1-2-3-4-5, the ETA and EPA shown. Usually, the pattern evolves over time. So what the trader would need to do is to watch the price evolution that forms points 1 to 5, then trace the lines that form the borders of the wedge into the future until the point of convergence (the apex). A vertical line traced downwards from the apex will give an approximation of where the EPA is supposed to be.
If you are trading the breakout, allow for a solid confirmation (3% penetration rule), or trade on the pullback to the broken wedge border.
Stop Loss
The stop loss would be set at a few pips above point 5 (in this example), or below point 5 if a long trade entry is made. If the short entry is made at the breakout point, then the stop loss should be placed above the highest candle in the wedge.
Long trade setup
The long trade setup occurs within the context of the Wolfe wave formation within the falling wedge, with the final outcome being a rise in price from point 5 all the way up to the EPA. Price is expected to break above the rising wedge on its way from point 5 to the downside, and this is captured in the chart below.
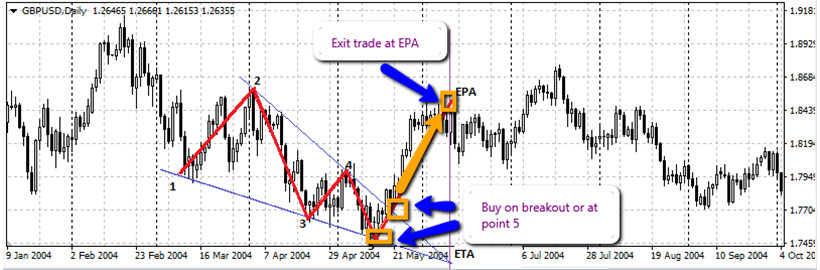
Long trade Wolfe Wave Pattern on GBP/USD Daily Chart
Ideally, the breakout should be accompanied by an increase in trading volume, which gives added confirmation to the breakout move.
Take Profit
In both situations, the Take Profit point is the EPA. Therefore it is important that traders trace the wedge borders to the point of convergence to be able to get the EPA, which is at the same vertical plane as the apex of the wedge (ETA).
Conclusion
It can be seen from the charts that detection of the Wolfe wave pattern on high timeframe charts such as the daily charts tends to produce many pips in the resultant price action. So it is advocated to use the 4-hour and daily charts to setup the pattern instead of the short time frame charts.